
Why Bitcoin Fell Below Critical Support Levels
CryptoQuant reports that Bitcoin has re-entered a bearish phase after dipping below its 200-day and 365-day moving averages, which sit at $72,900 and $75,900. The onchain analytics firm noted this shift in a Tuesday report.
Breaking news
 Claude AI Forecasts Chainlink Plunge in 2027
 XRP Crashes to $0.87 as ETF Assets Fall Below $1 Billion
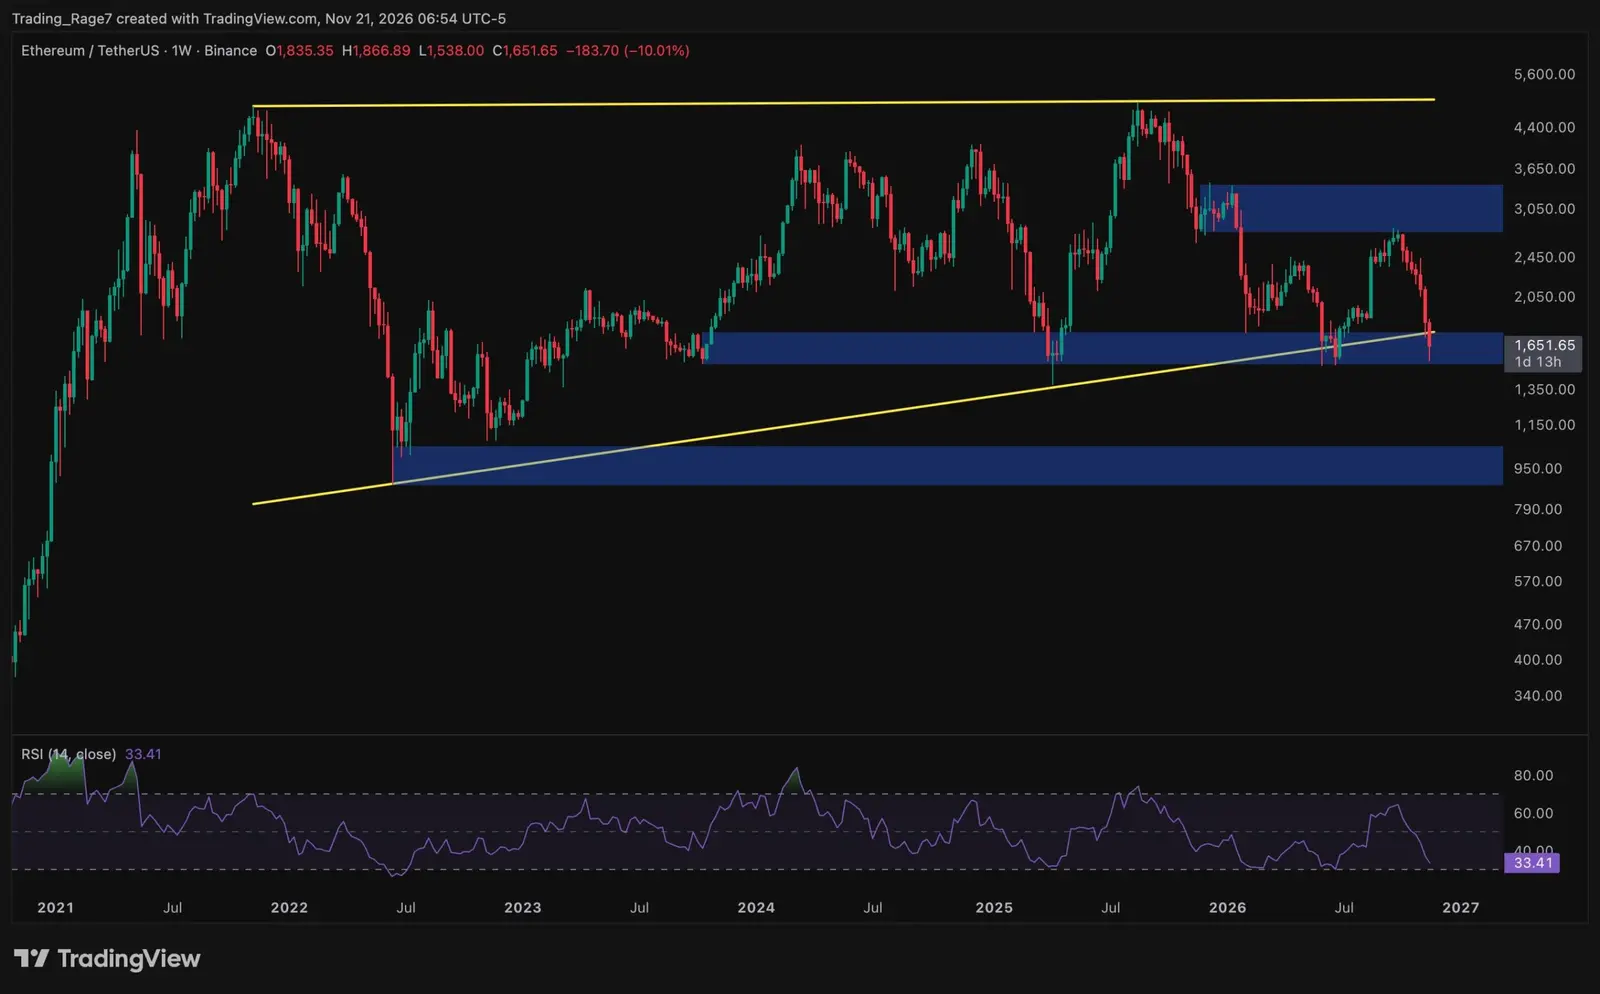 Ethereum price analysis: Did ETH hit its macro bottom after a 30% monthly drop?
 Bitcoin Reclaims $60,000 After Sharp Summer Selloff
The crypto asset hit a four-month low of approximately $61,000 on November 15. This decline effectively erased all gains from the rally that started on August 19. CryptoQuant describes the current price level as a value zonewhere buying interest may re-emerge.
Is This the Bottom, or Will Prices Keep Sliding?
The drop below both long-term moving averages signals a structural shift in market sentiment. Analysts at CryptoQuant emphasized that crossing under these benchmarks often precedes extended downtrends. The November 15 low marked the end of a three-month upward movement.
CryptoQuant's value zoneframing suggests the current price range may attract long-term buyers. However, the firm cautioned that confirming a reversal requires sustained price action above the 200-day average. Traders should watch for volume confirmation before assuming the decline has ended.
What is a value zonein Bitcoin trading? It refers to a price range where the asset is considered undervalued relative to historical trends. CryptoQuant uses this term to signal potential buying opportunities.
Frequently Asked Questions
How do moving averages signal a bearish phase? When Bitcoin falls below its 200-day and 365-day moving averages, it indicates sustained downward momentum. This pattern often precedes longer bear markets.
What happened on November 15? Bitcoin reached a four-month low of about $61,000, wiping out gains from the August 19 rally. This marked the transition into the current bearish phase.