
Institutional Withdrawal Drives Price Pressure
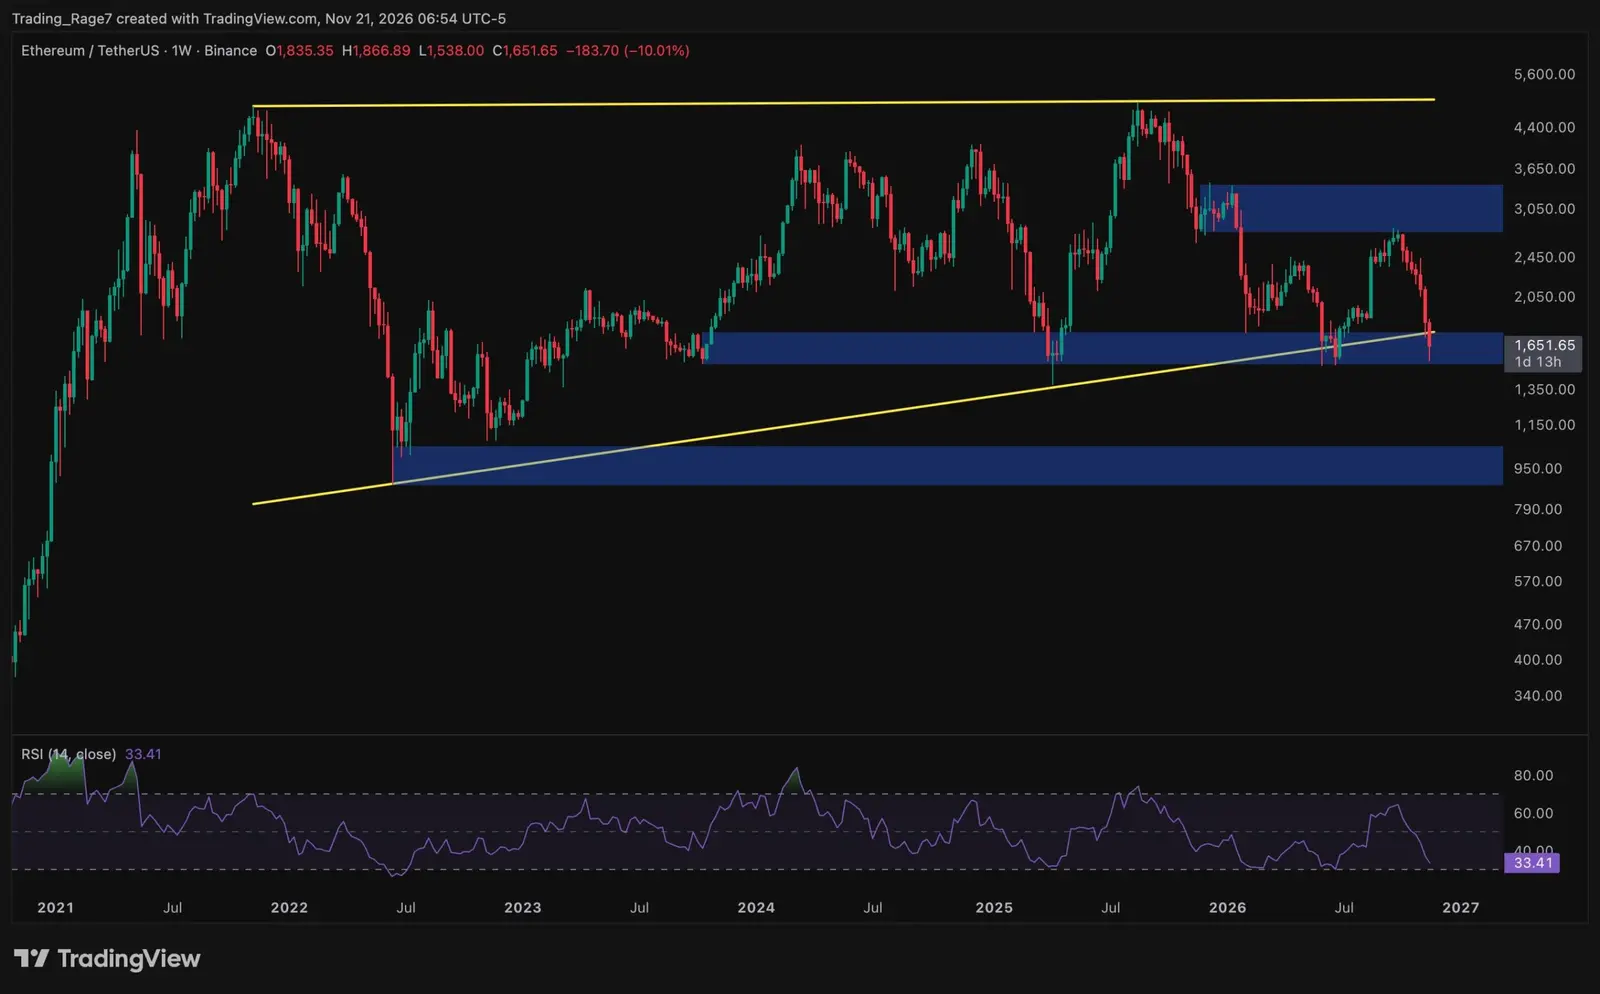
Ethereum dropped to approximately $1,735 on November 20, testing critical support levels near $1,700. This decline coincided with significant capital leaving the market. U. S. spot Ethereum exchange-traded funds recorded $208.5 million in net outflows over four trading sessions. Investors are watching closely to see if the asset can hold its ground against this selling pressure.
Breaking news
 Claude AI Forecasts Chainlink Plunge in 2027
 XRP Crashes to $0.87 as ETF Assets Fall Below $1 Billion
 Ethereum price analysis: Did ETH hit its macro bottom after a 30% monthly drop?
 Bitcoin Reclaims $60,000 After Sharp Summer Selloff
The recent price action reflects broader sentiment shifts among institutional investors. As money exits these regulated products, the immediate supply of Ethereum in the market increases. This dynamic often puts downward pressure on the token’s value. Traders are now focused on whether the $1,700 level will act as a floor or if further declines are imminent.
The $208.5 million in outflows represents a substantial shift in investor behavior. These funds typically seek exposure to Ethereum without holding the underlying asset directly. When they redeem shares, issuers sell the tokens, adding liquidity to exchanges. This mechanism creates a direct link between fund flows and spot prices. The consistent outflows over four days suggest a sustained lack of appetite for the asset in this specific investment vehicle.
Can Support Levels Hold Against Selling?
Market participants are analyzing the depth of this withdrawal. It is not a one-day anomaly but a multi-day trend. Such patterns often precede deeper corrections or signal a pause in bullish momentum. The fact that Ethereum tested $1,717.82 on Friday highlights the volatility present in the current environment. Traders are positioning themselves ahead of potential breakouts or breakdowns from these key zones.
The $1,700 mark has emerged as a psychological and technical barrier. Holding this level is crucial for preventing a cascade into lower price brackets. If sellers maintain their dominance, the next support areas may come into play. Analysts note that volume during these outflows is high, indicating active participation from large players. The market is currently in a tug-of-war between those exiting positions and those looking to buy the dip.
Frequently Asked Questions
Investors are also considering macroeconomic factors alongside these fund flows. Interest rate expectations and global liquidity conditions continue to influence crypto markets. However, the immediate catalyst here is the direct flow of capital from ETFs. This structured product channel has become a major driver of Ethereum’s price discovery. Its performance now dictates much of the short-term trajectory for the second-largest cryptocurrency.
How much did Ethereum ETFs lose recently? U. S. spot Ethereum ETFs recorded $208.5 million in net outflows over four trading sessions. This significant withdrawal contributed to the token’s decline toward the $1,700 support level.
What is the current price range for Ethereum? Ethereum traded as low as $1,717.82 on Friday. It subsequently moved around $1,735, continuing to test the nearby support zone as of November 20.