
Can XRP Recover from the Liquidation Storm?
A massive $1.48 billion liquidation storm has hit the cryptocurrency market, with XRP's price struggling to stay afloat. Retail traders are fixated on the $1 mark, but technical indicators suggest a further decline. The turmoil began on June 25, as XRP's value plummeted.
Breaking news
 ASIC consults on updated CFD safeguards for digital assets, deadline November 9, 2026
 Papertrade Trader Losses Hit $32.4 Million Just Two Days After Launch
 Strategy Buys 250 Bitcoin, Sells Shares to Fund Purchase
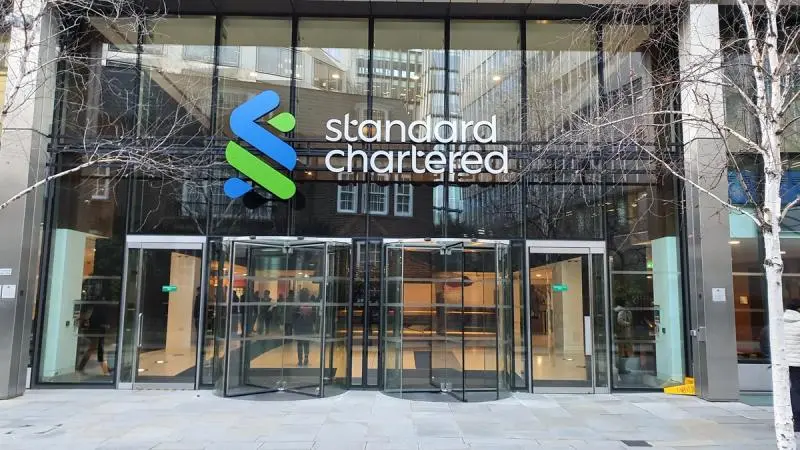 Standard Chartered Announces RLUSD Custody Services in Dubai and Explores LMAX Collateral Integration
Monthly Bollinger Bands indicate a deeper, technically justified bottom at $0.91, casting doubt on $1 as a viable support level. This technical indicator is a key tool for traders, helping them identify potential price movements.
The $1.48 billion liquidation has put immense pressure on XRP's price. With the monthly Bollinger Bands pointing to $0.91, investors are bracing for a potential further decline.
Will Technical Indicators Prove Correct This Time?
Historically, Bollinger Bands have been a reliable indicator of price movements. If the trend continues, XRP's price could be headed for a significant drop.
The consequences of this downward trend could be severe, with XRP's price potentially falling to $0.91. This would represent a significant loss for investors who were hoping the $1 mark would provide support.
Frequently Asked Questions
What is the current price target for XRP according to Bollinger Bands? The monthly Bollinger Bands indicate a price target of $0.91. This is a significant drop from the current price.
Is $1 a viable support level for XRP? Technical indicators suggest that $1 may not be enough to halt the downward trend. A further decline is possible.
What triggered the $1.48 billion liquidation storm? The liquidation storm was triggered by a significant price drop in the cryptocurrency market. The exact cause is unclear.