
Technical Indicators Signal Market Hesitation
Bitcoin recently retreated to approximately $75,800, forcing market buyers to urgently defend the crucial $75,000 price threshold amid sluggish daily momentum. This sudden downward movement has disrupted optimistic forecasts from analysts who previously anticipated a swift rebound toward the $81,000 to $82,000 range.
Breaking news
 Claude AI Forecasts Chainlink Plunge in 2027
 XRP Crashes to $0.87 as ETF Assets Fall Below $1 Billion
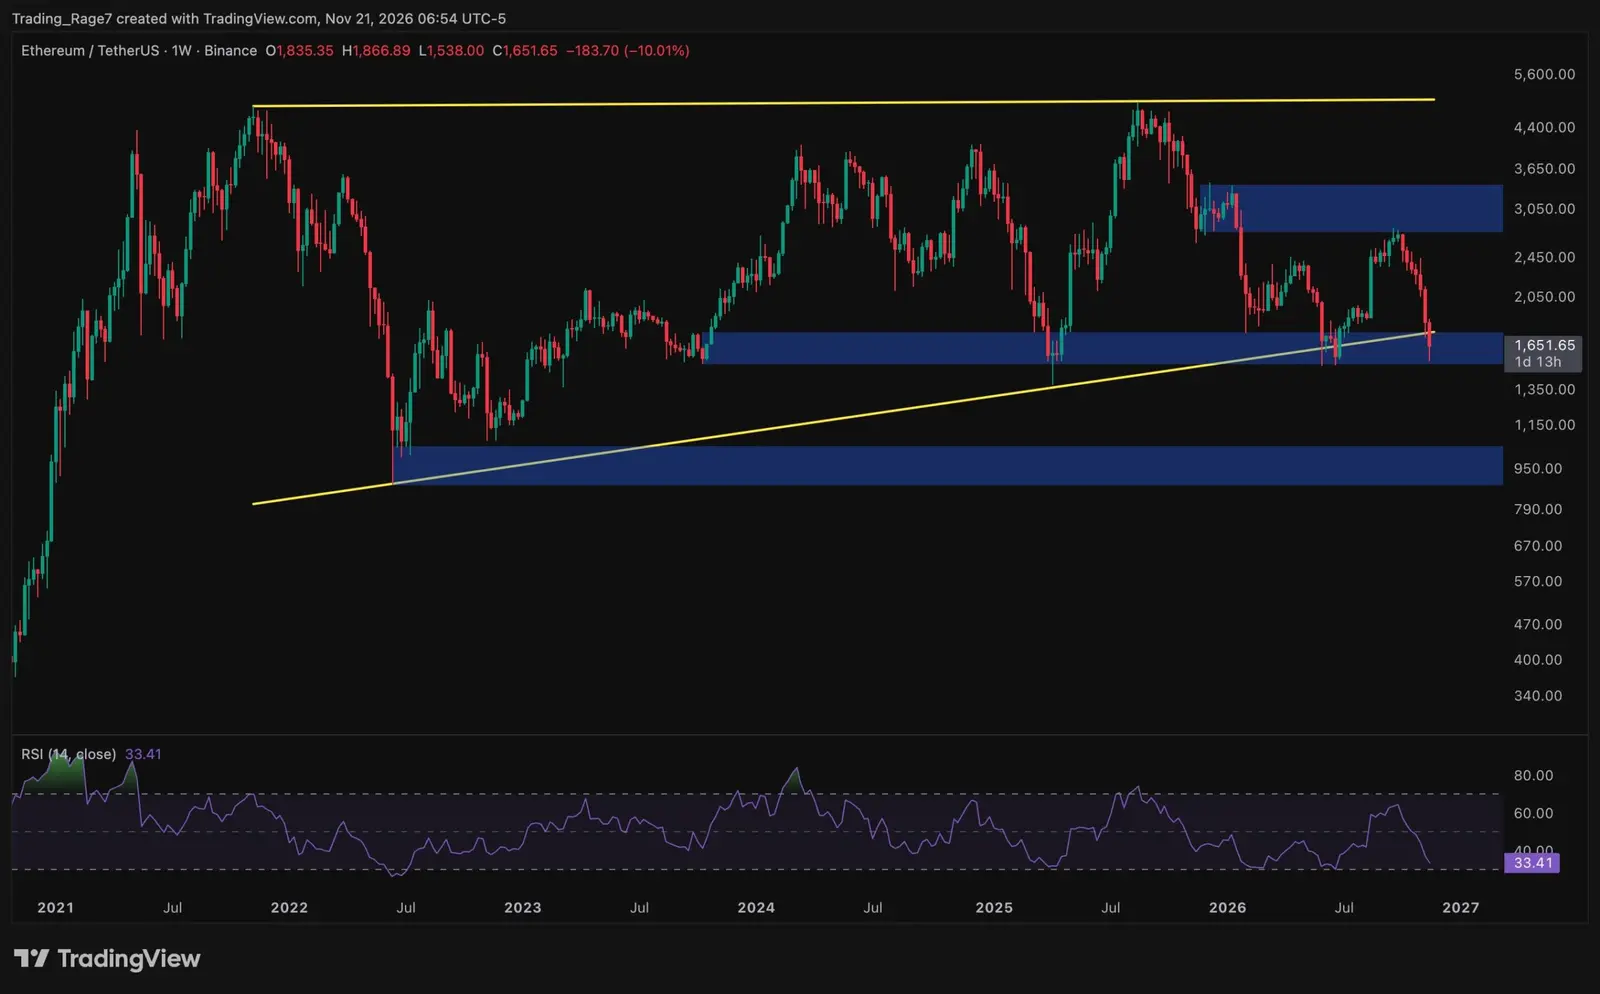 Ethereum price analysis: Did ETH hit its macro bottom after a 30% monthly drop?
 Bitcoin Reclaims $60,000 After Sharp Summer Selloff
The premier cryptocurrency currently hovers near the lower boundary of its daily Bollinger band. This technical indicator typically signals heightened volatility or persistent selling pressure in the immediate term. Furthermore, the Relative Strength Index sits below the neutral threshold at 37.82, highlighting a prevailing lack of buying enthusiasm across daily trading sessions.
Can Buyers Overcome Weak Momentum?
Despite the cautious daily outlook, weekly charts reveal a resilient defense by market participants. Prices experienced a brief dip beneath the vital $75,000 pivot point before swift intervention from buyers pushed the asset back upward. This defense demonstrates underlying demand near psychological support levels, even as momentum indicators remain subdued.
Traders continue to monitor these key technical boundaries closely to gauge whether market participants can muster enough strength to reverse the current downward trend. Without a significant shift in daily momentum, reclaiming previous highs above $80,000 remains a challenging objective for the near future.
Sustaining the current price floor will depend heavily on whether buyers can neutralize prevailing selling pressure. Analysts warn that failure to hold the $75,000 threshold could trigger further consolidation or deeper retracements across the broader crypto market.
Frequently Asked Questions
What is Bitcoin's current trading price? Bitcoin recently slipped to approximately $75,800, with buyers actively defending the critical $75,000 support level.
What do technical indicators suggest about market momentum? Daily indicators show weakness, with the Relative Strength Index resting below neutral at 37.82 and prices touching the lower Bollinger band.