Breaking Out or False Signal?
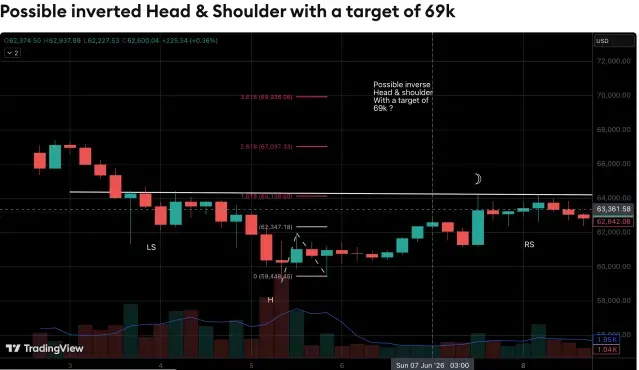
A prominent analyst on TradingView has identified a potential reversal pattern in Bitcoin's daily chart, sparking optimism among investors. The analyst, known as fibsrus, suggests a significant price surge is possible. Bitcoin's price action is being closely watched.
Breaking news
 Dogecoin Co-Founder Identifies Weak Demand as Catalyst for Crypto Market Slump
 Dogecoin Bounces Back After Brutal 65% Year-Long Slide
 Bitcoin Miners Face Hardware Shortage as AI Boom Strains Chip Supply
 Claude AI Forecasts Chainlink Plunge in 2027
The identified pattern is an inverse head-and-shoulders formation, a bullish reversal indicator. If Bitcoin breaks and closes above the neckline, the projected target is around $69,000. This would represent a substantial increase from current levels.
To confirm the pattern, Bitcoin must break through and sustain a close above the neckline. Failure to do so, or a drop below the current support level, would invalidate the setup. The analyst's observation has garnered significant attention, with many investors eagerly awaiting a breakout.
Can Bitcoin Sustain a Breakout?
The inverse head-and-shoulders pattern is a reliable indicator of a potential trend reversal. If validated, it could signal the beginning of a new uptrend. Investors are cautious, however, as false signals can occur.
A sustained break above the neckline would be a positive sign for Bitcoin. It would indicate a shift in market sentiment and potentially attract more buyers. Conversely, a failed breakout could lead to a decline in price.
A successful breakout could propel Bitcoin's price to $69,000, driven by increased buying pressure. This would have significant implications for the cryptocurrency market.
Frequently Asked Questions
What is an inverse head-and-shoulders pattern? An inverse head-and-shoulders pattern is a chart formation indicating a potential reversal of a downtrend, characterized by a lower low flanked by two higher lows.
Is the $69,000 target realistic? The target is based on the analyst's projection, assuming a successful breakout and sustained price action above the neckline.
What happens if Bitcoin fails to break out? A failed breakout would likely invalidate the inverse head-and-shoulders pattern, potentially leading to a decline in Bitcoin's price.