Why Are Short Sellers Holding Their Ground?
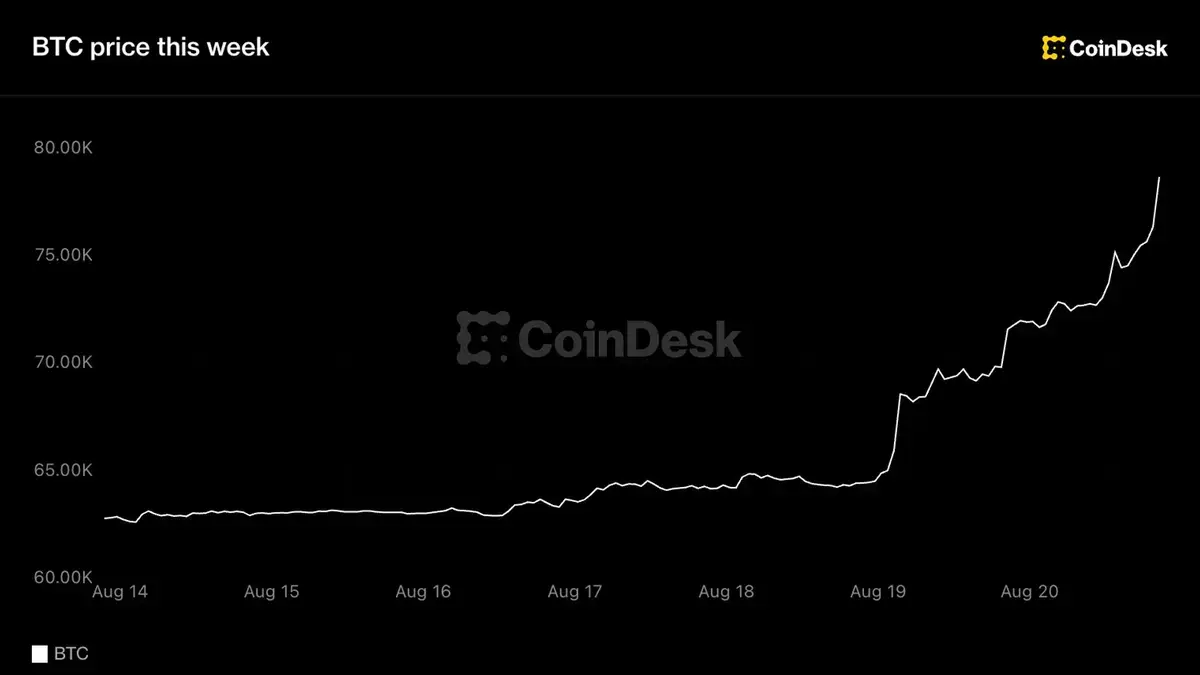
Bitcoin climbed above $77,000 on Friday, marking its best weekly performance since early 2023 after gaining 24% since Monday. The rally pushed the cryptocurrency to a level aligned with an inverse head-and-shoulders pattern breakout, a technical signal often interpreted as bullish by traders. Despite the upward momentum, a notable number of short sellers maintained their bearish positions, betting against further gains.
Breaking news
 Binance to Limit Services and Remove Tokens for Brazil Users Starting October 27, 2026
 Bitcoin Price Prediction: Is the US Government Behind The Crypto Crash?
 AI Infrastructure Spending Fuels New Bitcoin Headwind
 Securitize Launches Tokenized Shares of Apple, Nvidia and Tesla on Solana
Technical Breakout Fuels Market Confidence The price move corresponds to a projected target from a chart pattern identified earlier in the week, suggesting the rally may have been anticipated by technical analysts. Bitcoin’s rise has lifted broader cryptocurrency markets, with several altcoins following suit as investor sentiment improved. Trading volumes increased alongside the price gain, indicating heightened market participation. Analysts noted that the breakout occurred amid reduced selling pressure on exchanges, which may have contributed to the sharp ascent.
What Could Trigger the Next Move in Bitcoin?
Despite the strong upward trend, a significant portion of traders continue to hold short positions in Bitcoin, reflecting skepticism about the sustainability of the rally. Some market observers suggest these contrarian bets are based on concerns over macroeconomic uncertainty or potential regulatory developments. Others point to profit-taking behavior at key resistance levels as a reason for maintaining downside exposure. The persistence of short interest highlights a divided market outlook, even as prices climb.
Future price direction may depend on whether Bitcoin can hold above current levels and attract additional buying interest. A sustained break above $77,000 could encourage more institutional participation, while a failure to maintain momentum might trigger a pullback toward recent support zones. Traders are also watching for cues from traditional financial markets, including interest rate expectations and inflation data, which often influence risk appetite. The balance between bullish technical signals and bearish positioning will likely shape near-term volatility.
What does the inverse head-and-shoulders pattern indicate? This chart pattern is generally seen as a reversal signal suggesting a potential shift from a downtrend to an uptrend, with the breakout level often serving as a price target.
Frequently Asked Questions
Why are short sellers still active despite the price rise? Some traders believe the rally may be overextended or driven by short-term factors, prompting them to maintain bearish bets in anticipation of a correction.
Could altcoins continue to benefit from Bitcoin's gain? Historically, strong Bitcoin performance often lifts sentiment across the crypto market, leading to increased investment in alternative digital assets, though the extent varies by project and market conditions.