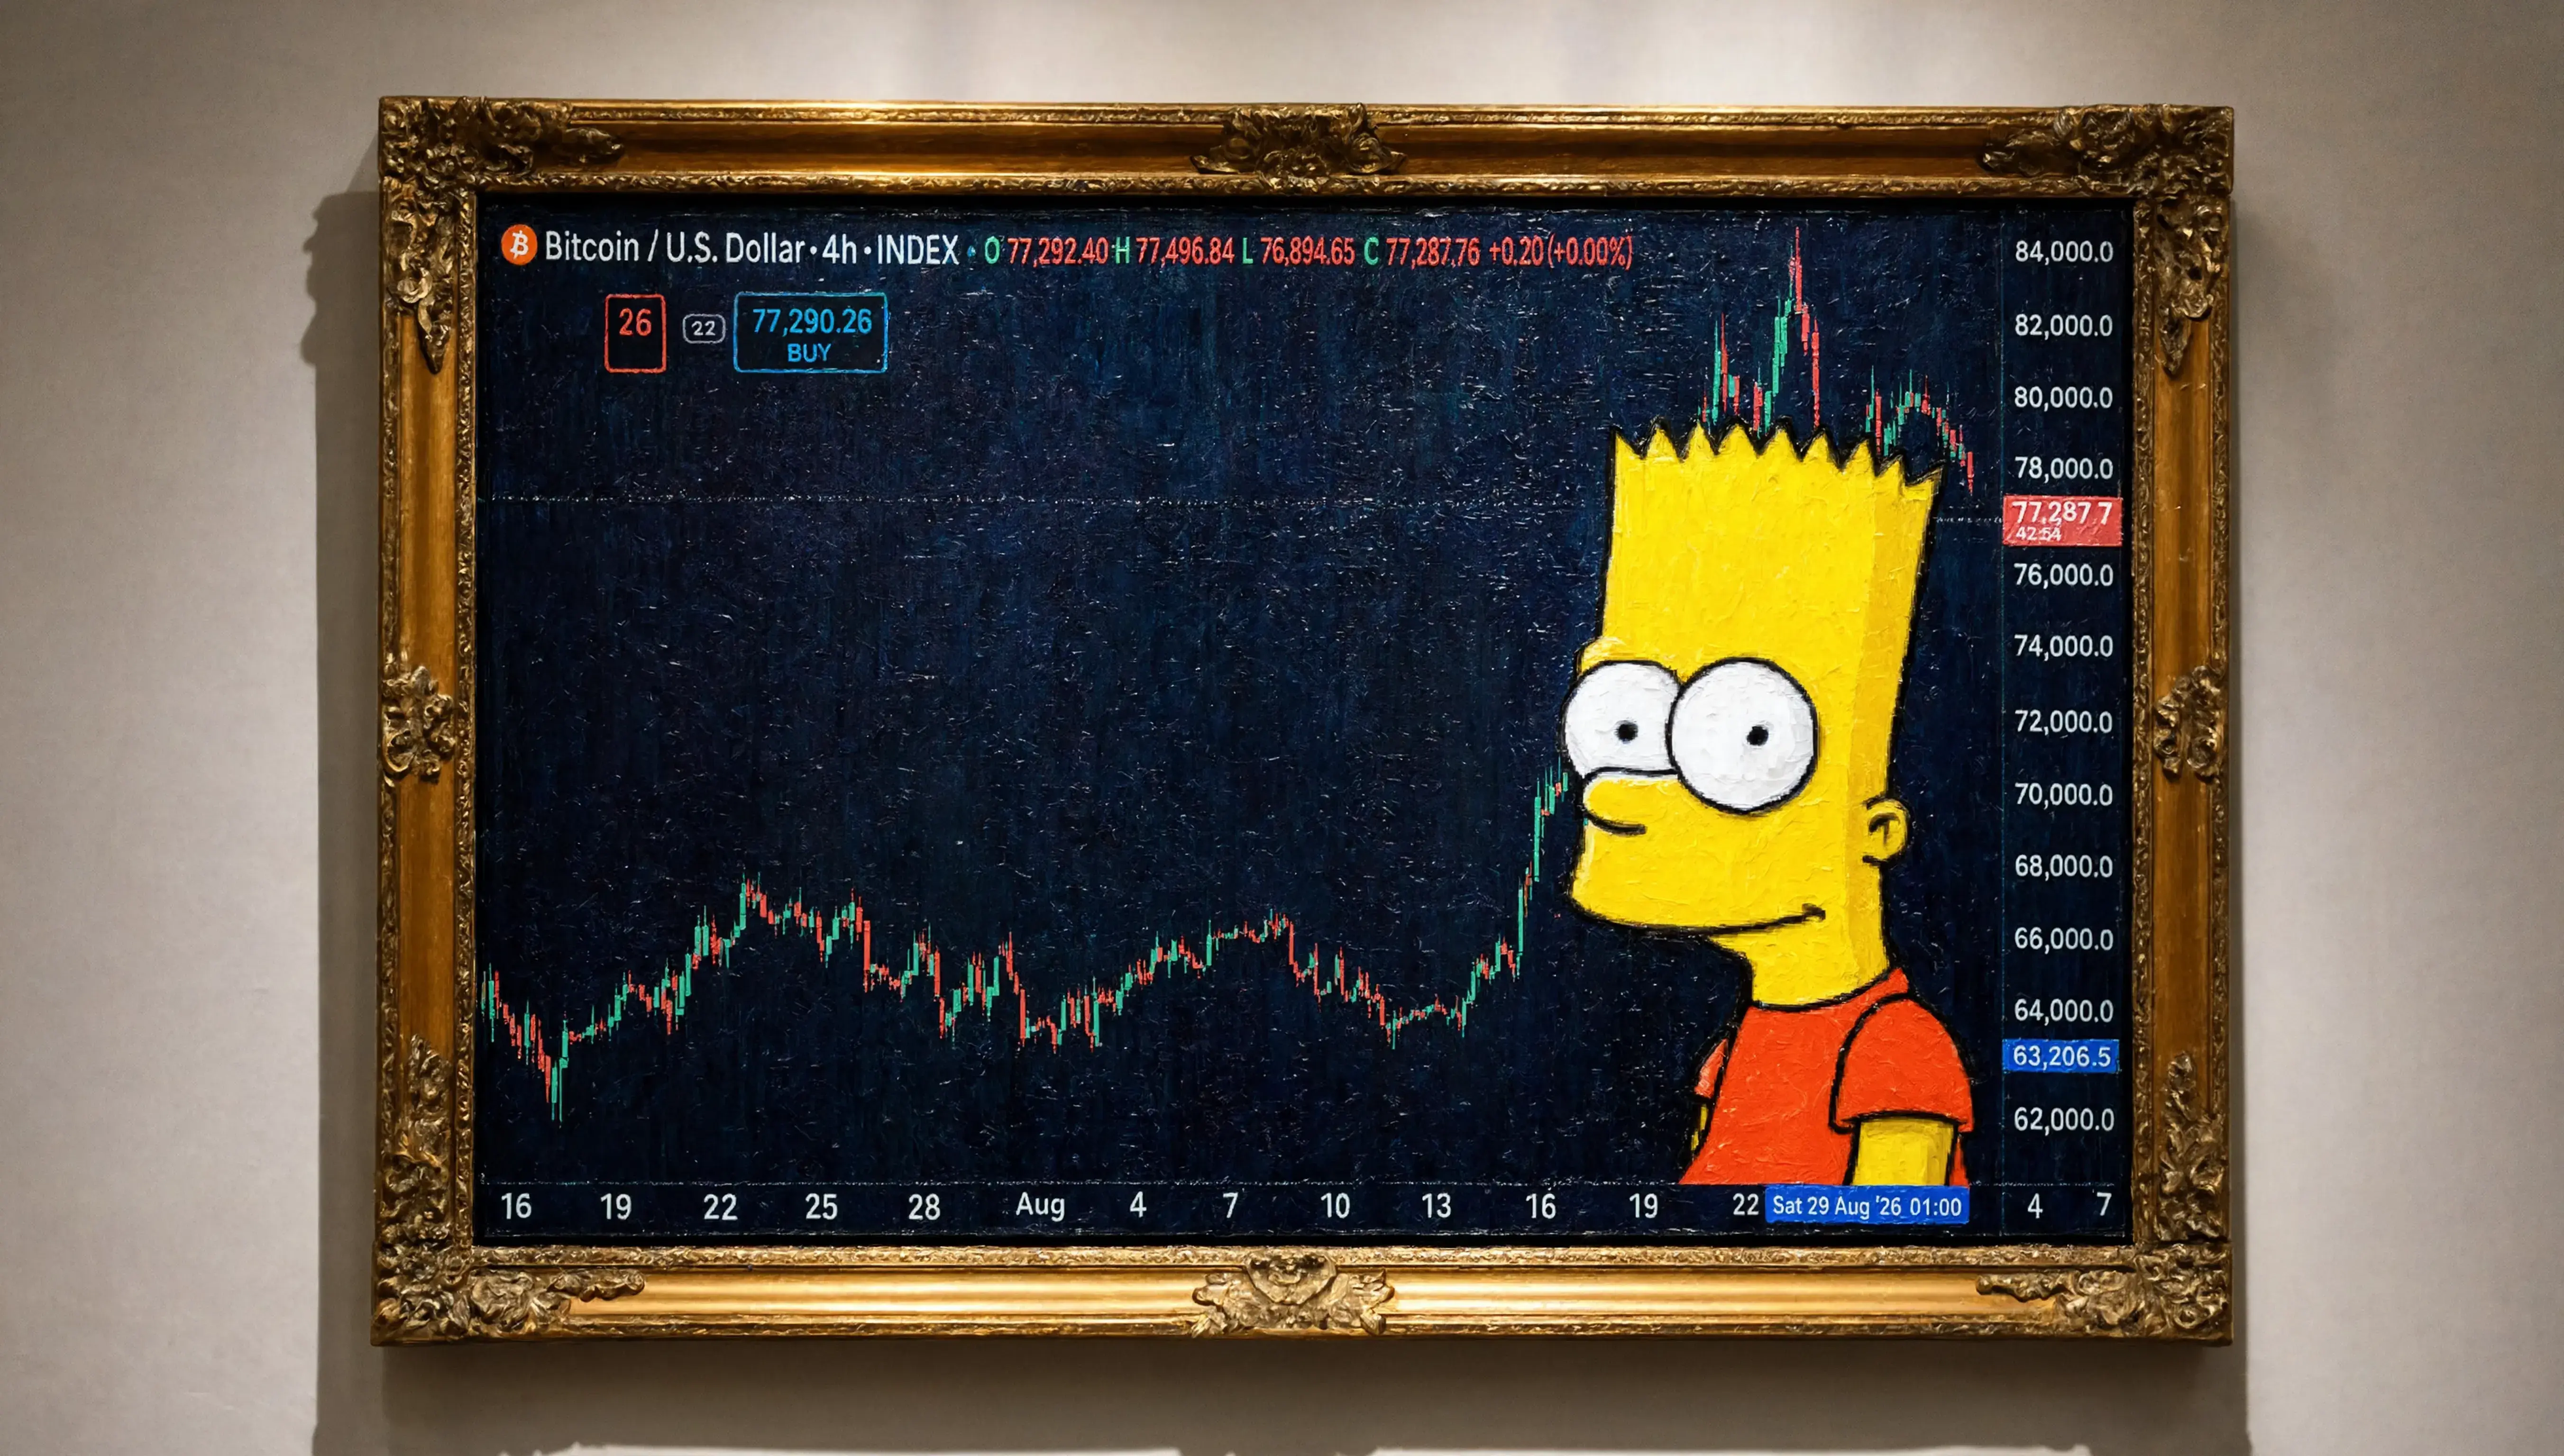
Is the „Bart Simpson” Label Misleading?
Bitcoin hovered around $77,500 on Monday after a rapid climb from $64,420 to nearly $80,700 in just six trading days. Traders dubbed the swing a „Bart Simpson” pattern, a term usually reserved for sharp, short‑lived spikes that often precede steep declines. However, technical indicators on the four‑hour chart suggest the market is merely pausing, not entering the breakdown phase that defines a true Bart Simpson formation.
Breaking news
 Fitch says power, not chips, will decide Taiwan’s AI data centre growth
 Vitalik Buterin Warns AI Could Break Crypto Math Sooner Than Quantum Computers
 Justin Drake Calls for „Bunker Mode” Migration to New Crypto Addresses
 XRP Eyes $2 Breakout, Analyst Highlights Key Resistance
The price surge began in early August, driven by a mix of renewed institutional interest and a wave of retail buying after a prolonged bearish stretch. Within a week, Bitcoin’s value rose more than 20%, prompting speculation of an imminent flash crash. Yet, the pattern’s hallmark—an abrupt peak followed by a rapid, sustained drop—has not materialized. Instead, the cryptocurrency’s momentum indicators, such as the Relative Strength Index and Moving Average Convergence Divergence, are flattening, signaling a consolidation rather than a collapse. Analysts point to the $75,800 level as a critical threshold; a breach below could revive concerns of a deeper correction, while holding above may allow the rally to extend.
The term „Bart Simpson” originates from chart‑pattern enthusiasts who liken a sharp, hairline spike to the cartoon character’s spiky hair. In classic usage, the pattern forms a brief, high‑volume surge that quickly reverses, often catching traders off‑guard. In Bitcoin’s case, the recent rise lacked the violent reversal that defines the pattern’s completion.
„Technical tools are showing a market that’s simply taking a breath,” said Maya Patel, a senior analyst at CryptoMetrics. „The price action is more akin to a consolidation phase after a strong move, not the frantic sell‑off we’d expect from a true Bart Simpson.” Patel added that the current price range aligns with a typical „pause” after a rapid rally, where traders reassess positions and liquidity providers adjust order books.
Could Bitcoin Still Face a Sudden Drop?
The distinction matters because mislabeling can trigger panic selling. When traders believe a crash is imminent, they may rush to liquidate, creating the very drop they fear. By clarifying that the indicators do not support a full pattern, analysts hope to temper emotional trading and encourage a more measured approach.
Even without a textbook Bart Simpson formation, Bitcoin remains vulnerable to rapid corrections. The cryptocurrency market is still sensitive to macroeconomic news, regulatory announcements, and large‑scale whale movements. A sudden sell‑off by a major holder or an unexpected policy shift could still push prices below the $75,800 support zone, igniting a sharper decline.
„Crypto is inherently volatile, and a single catalyst can change the narrative in minutes,” warned Luis Ortega, a market strategist at Global Digital Assets. „While the current technical picture is stable, we must stay vigilant for external shocks that could trigger a flash crash.”
Frequently Asked Questions
If Bitcoin holds above $75,800, the next target could be the $82,000‑$85,000 range, where earlier resistance levels lie. Conversely, a break below $75,800 may open the path to $70,000 and possibly lower, reviving concerns about a broader market correction.
What exactly is a „Bart Simpson” pattern? It is a chart formation resembling a short, sharp spike—like the cartoon character’s hair—followed by an immediate, steep decline. Traders use it to anticipate rapid price drops after brief rallies.
Why are analysts saying Bitcoin isn’t in a Bart Simpson pattern now? Current technical indicators show a flattening trend rather than a violent reversal. The price has paused near $77,500 without the rapid sell‑off that would complete the pattern.
What should investors watch for next? Key levels are $75,800 for support and $82,000‑$85,000 for potential upside. Breaking the support could trigger a sharper decline, while holding above it may allow the rally to continue.