
Detailed Analysis of the Cryptocurrency Market Amid Global Volatility
Bitcoin's sharp decline marked a tough period for crypto. It reached a low near $74,780.91. The current price on Friday hovers near $75,570. Technical analysis shows the 50-day moving average is above the 200-day. However, chart patterns suggest a developing downtrend.
Breaking news
 Claude AI Forecasts Chainlink Plunge in 2027
 XRP Crashes to $0.87 as ETF Assets Fall Below $1 Billion
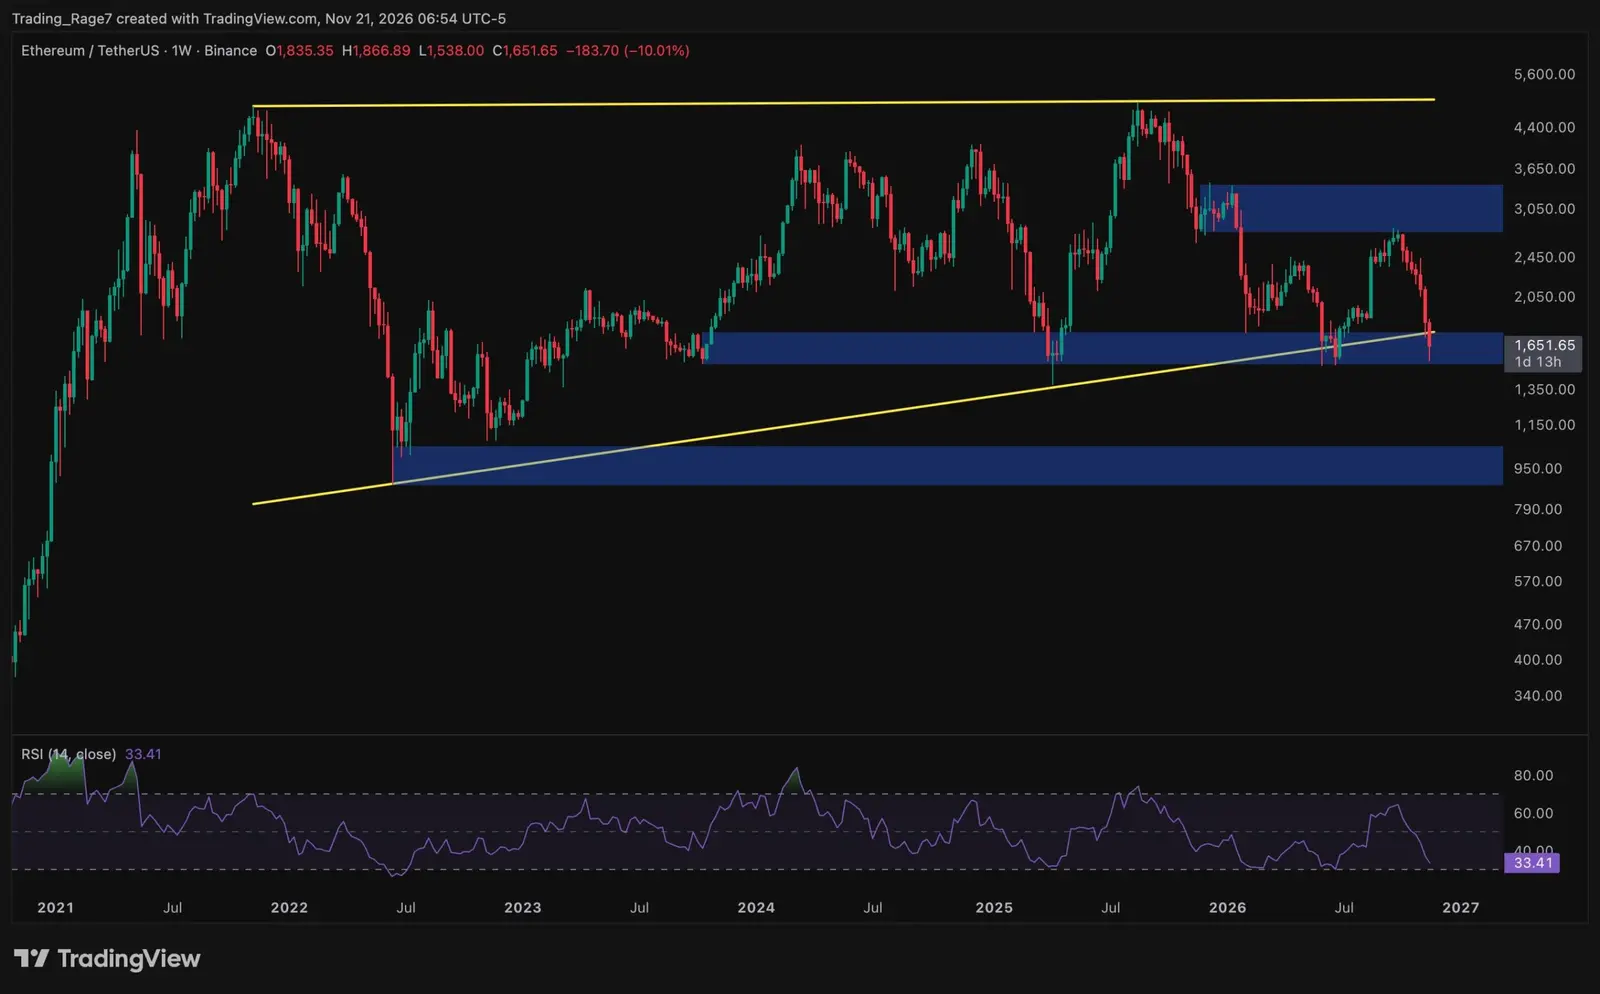 Ethereum price analysis: Did ETH hit its macro bottom after a 30% monthly drop?
 Bitcoin Reclaims $60,000 After Sharp Summer Selloff
Intense Volatility Manifests in Major Liquidations
CoinGlass tracked $1.05 billion in liquidations across monitored markets. Long positions drove 88.2% of this total. Longs totaled $930.04 million versus $124.69 million from shorts. This aligns with the Fear and Greed Index at 28. This score nears extreme fear, where 0 is maximum fear. Last week, the index was neutral before midterm elections.
Context of the Movement
A severe drop in AI stocks influenced this shift. Forced liquidations also hit derivatives markets. Furthermore, the robust October US employment report raised Fed rate hike expectations for December. Higher borrowing costs pressure speculative markets. This affects crypto even as chip stocks recover.
Individual Contributions to Liquidations
Bitcoin contributed $267.20 million to the total liquidations. 88.9% of Bitcoin liquidations were from long positions. Ethereum saw $167.14 million in liquidations. 81.1% of Ethereum liquidations were also long positions. Liquidation occurs when a platform closes a position due to insufficient collateral. Leverage trading risks total capital loss if price thresholds are breached.
Stock Market Context
US markets suffered after midterm election fears. The Nasdaq Composite fell 5.52%, its worst session in 19 months. The Philadelphia semiconductor index dropped over 12%. Nvidia alone lost more than 9%. Democratic wins sparked worries about stricter AI regulation. This could slow data center development for chip growth. S&P 500 also fell 4.36%, erasing about $3 trillion in market value.
Current Technical Analysis of Bitcoin
Bitcoin trades near $75,570 after hitting the $74,780.91 low. The weekly chart shows a red candle and lower peaks from September. The 50-day EMA is near $79,756, above the 200-day EMA at $76,497. This order suggests a longer-term positive trend. Yet, trading below both averages signals recent selling pressure outweighs long-term positivity. The RSI is 37.7, below 50 but above the 30 oversold level. The ADX is 19.7, indicating no clear direction, though negative directional pressure is slightly stronger.
Key Support and Resistance Levels
The immediate support is $74,780, the intraday low. A daily close below this level targets $73,000 to $72,500. A further drop could test the $70,000 psychological level. A recovery first faces the 200-day EMA near $76,497. Immediate resistance follows near $80,000. Friday's daily candle is open, making $74,780.91 a critical short-term defense point.
Note of Despair
Any opinion or interpretation provided here is not financial or investment advice.