
Solana (SOL) Loses $100 as Sellers Take Control
Solana (SOL) has fallen below the key psychological level of $100. Selling pressure continues to intensify. After a strong run in September that pushed SOL above $120, the token entered a long correction. Sellers now dominate daily trading. On November 4, SOL traded around $92.69. This extends the decline from October peaks near $124. On the daily chart, the picture remains bearish. Solana trades below all major moving averages. It also dropped below the long-term moving average near $98. This level acted as support during the September recovery. This break places Solana in a weak position. The $98–$100 zone is now the nearest resistance. A clean recovery above it could improve sentiment. It would allow SOL to test the $103–$108 zone. As long as price stays below these levels, the chart remains bearish. The Relative Strength Index (RSI) has slid toward the lower end of its range.
Breaking news
 Claude AI Forecasts Chainlink Plunge in 2027
 XRP Crashes to $0.87 as ETF Assets Fall Below $1 Billion
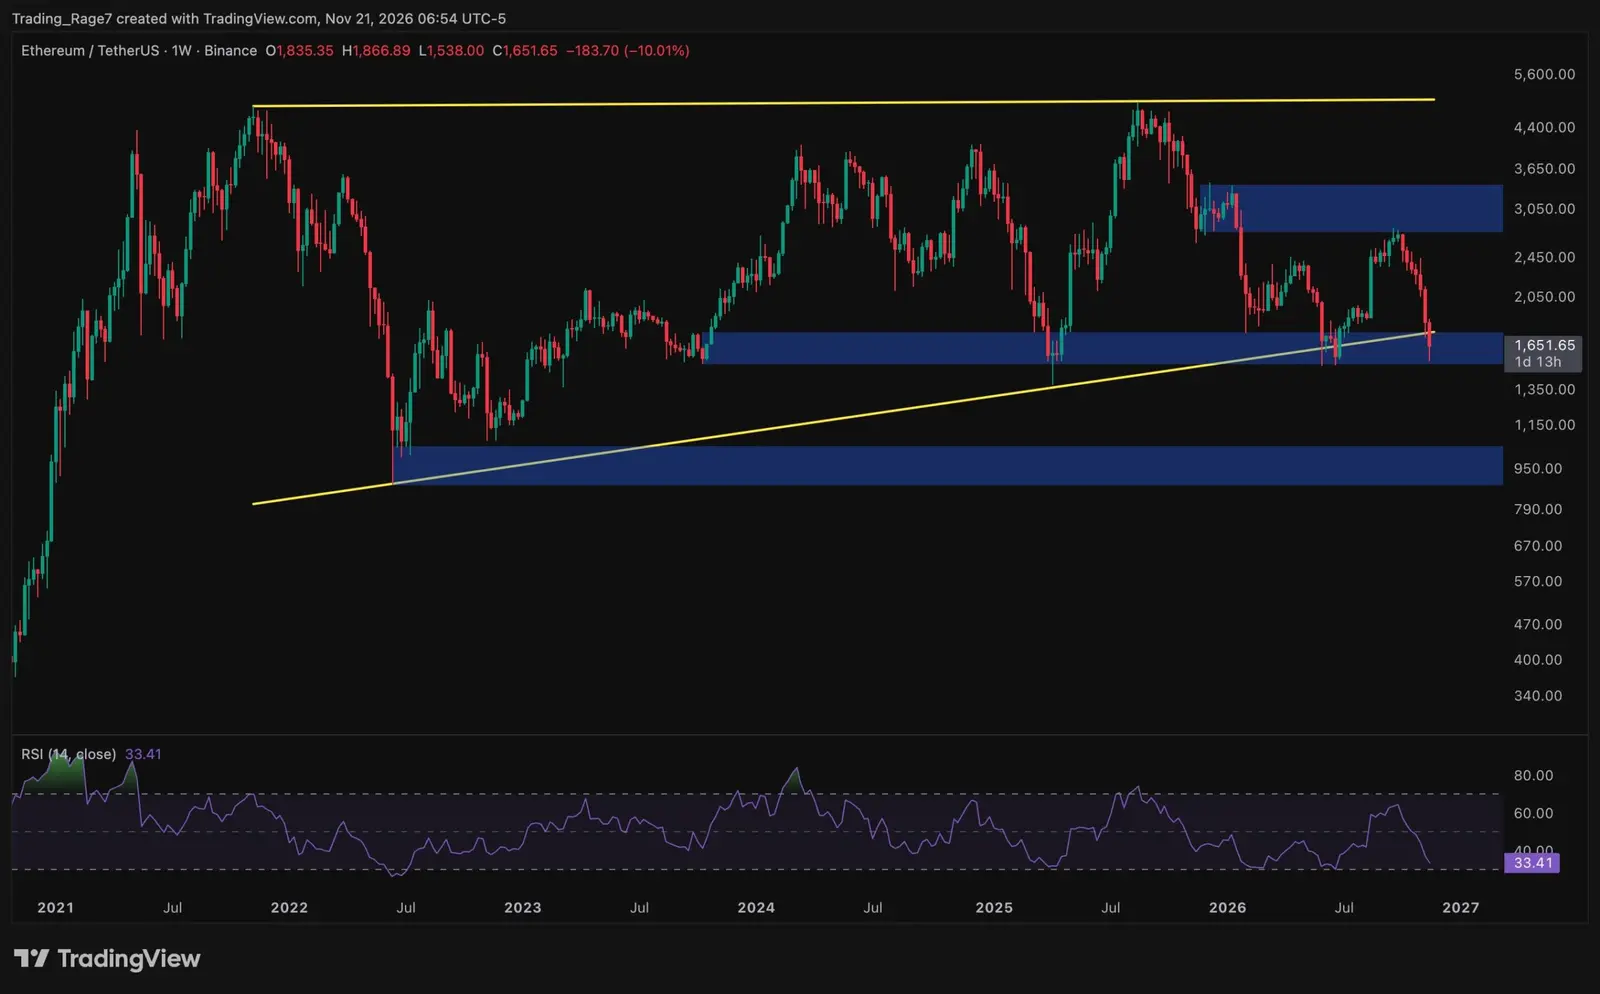 Ethereum price analysis: Did ETH hit its macro bottom after a 30% monthly drop?
 Bitcoin Reclaims $60,000 After Sharp Summer Selloff
It is approaching the oversold zone. Selling pressure may exhaust at some point. However, the indicator has not yet shown a convincing bullish reversal. Trading volume also increased during the latest decline. This makes the breakdown more significant. The nearest support lies around $90. Buyers may try to stop the decline there. A clear break below this level could send Solana toward $85, then the $80 zone. Recapturing $100 would be the first real step toward rebuilding bullish momentum. Unfortunately for bulls, Solana remains bearish for now. Sellers are firmly in control after breaking below multiple moving averages.
Ethereum (ETH) Tries to Rise Near $2,317
Ethereum (ETH) is trying to find its footing after a correction. This correction erased much of the September gains. It shows early signs of a bounce from recent lows. However, the second-largest crypto faces heavy resistance. The short-term outlook is far from clear. According to the daily ETH/USD chart on November 4, Ethereum traded around $2,317. This is a modest rise after a brief dip toward the $2,200 zone. Buyers have not yet taken control. The recent weakness began with a rejection from the $2,750–$2,800 resistance zone in early October. Since then, ETH has made lower highs and lower lows. This is a clear sign of persistent selling pressure. ETH is now below several key moving averages. These include short-term averages around $2,400–$2,500. The nearest resistance is around $2,350. More selling pressure is possible around $2,400. ETH needs a clean break above these levels.
Only then can anyone say the decline is losing steam. Ethereum is also near its long-term moving average around $2,300. This makes the current price zone critical for the next move. The RSI dropped sharply from October peaks as bullish momentum faded. However, it is starting to flatten near the lower end of its range. This suggests selling pressure may be easing. This could support a short-term bounce. But a flat RSI alone does not confirm a trend reversal. The nearest support is around $2,250. This is followed by the key psychological level of $2,200. A break below this zone could open the door to a deeper correction toward $2,100. On the upper side, recapturing $2,350 would be a good first step. A move above $2,400 would make the case for a stronger recovery toward $2,500.
Near Protocol (NEAR) Slides Below Key Averages
Near Protocol (NEAR) could not sustain its October gains. Sellers are back in control. NEAR is back in correction mode. The price is falling below several key technical indicators. According to the daily chart on November 4, NEAR trades around $4.02. This is far below its October peaks near $6. NEAR has slid below its short-term moving averages. This is a clear sign that bullish momentum is fading. The $4.30–$4.60 zone is now the key resistance. Multiple moving averages cluster here. Buyers must break through this zone to signal a recovery. Support lies near $3.80. A break below this level could push NEAR toward $3.50. The RSI is also declining. It is approaching oversold territory. This could set the stage for a bounce. However, without a volume surge, the bounce may lack follow-through. Traders should watch the $4.30–$4.60 resistance closely.
A confirmed break above it would be the first sign of a trend change. Until then, the bearish structure remains intact.