Breakdown of the Triangle Formation
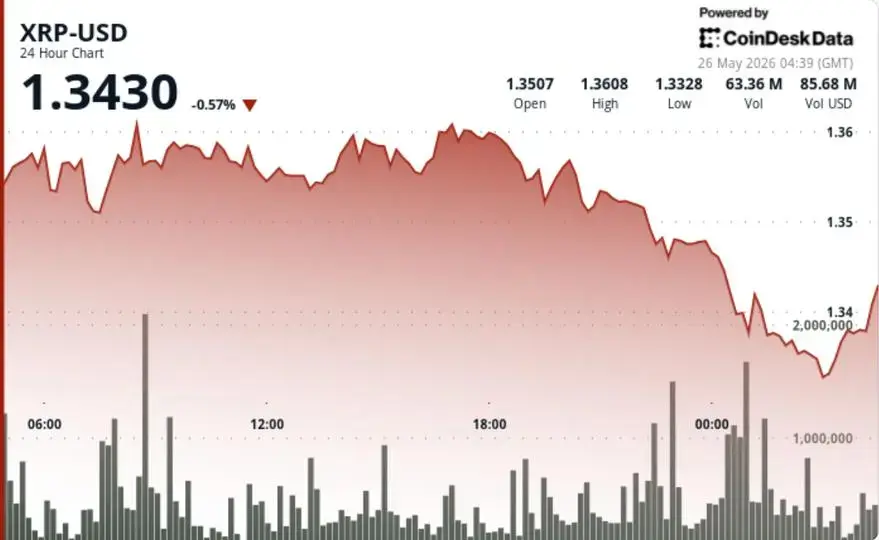
XRP fell beneath $1.35 on Monday, May 25, 2026, following a breakdown in its long-standing triangle pattern. The move erased hopes of a bullish breakout, shifting trader focus to the $1.30 support level as selling pressure mounted in global crypto markets.
Breaking news
 Ethereum Reserves on Binance Hit Seven-Month Low Amid Sharp Liquidity Decline
 Ontology Halts L1 Blockchain for 41 Hours Over an Unknown Threat
 Ethereum Visionary V. Buterin Announces 2030 Upgrade Roadmap
 Bitcoin Shows Early Bullish Signs Despite Struggle to Surpass $84,000
The decline follows multiple failed attempts to push XRP above resistance near $1.40. Over recent months, the token traded in a tightening range, forming a symmetrical triangle often seen before major price moves. This pattern typically signals either accumulation or distribution. In this case, the downward break suggests bears have taken control. Trading volume spiked as the price dropped, confirming bearish momentum.
Technical analysts had closely monitored the triangle pattern on XRP’s daily chart for weeks. The formation began in early 2026 as price swings narrowed between converging trendlines. Upper resistance held near $1.40, while support gradually rose from $1.25. Each failed breakout weakened bullish sentiment.
Can XRP Hold $1.30 and Rebound?
„The triangle was a coiling spring,” said market analyst Lena Cho. „When it snapped below $1.35, it triggered stop-loss orders and short entries. The structure suggested a measured move toward $1.30, maybe lower if volume stays strong.”
On-chain data from May 25 showed increased sell-side pressure, with large wallets moving over 150 million XRP to exchanges. This often precedes further price declines as supply hits the market. Open interest in XRP futures also dropped 8% in 24 hours, signaling position unwinding.
Traders are now watching the $1.30 level as the next critical defense. A hold here could spark a corrective bounce, especially if broader market sentiment improves. However, a close below $1.30 on daily charts may open the door to $1.20, targeting the lower end of the original triangle’s range.
Short-term indicators remain bearish. The Relative Strength Index (RSI) dipped below 40, showing weakening momentum without yet reaching oversold territory. Moving averages have flipped, with the 50-day now above the 200-day on the weekly chart, reinforcing the short-term downtrend.
Frequently Asked Questions
Why is the triangle pattern important for XRP? Triangle patterns signal potential big moves after periods of consolidation. The breakdown below $1.35 confirms bearish control, suggesting further downside unless price quickly recovers.
What happens if XRP breaks below $1.30? A sustained break could trigger more selling, potentially pushing XRP toward $1.20. Traders will watch volume and exchange flows to gauge the strength of the downtrend.
Is this drop linked to broader market trends? While Bitcoin and Ethereum showed mild gains, altcoins like XRP are under pressure. Sector-specific sentiment and technical factors appear to be driving the move more than overall market conditions.