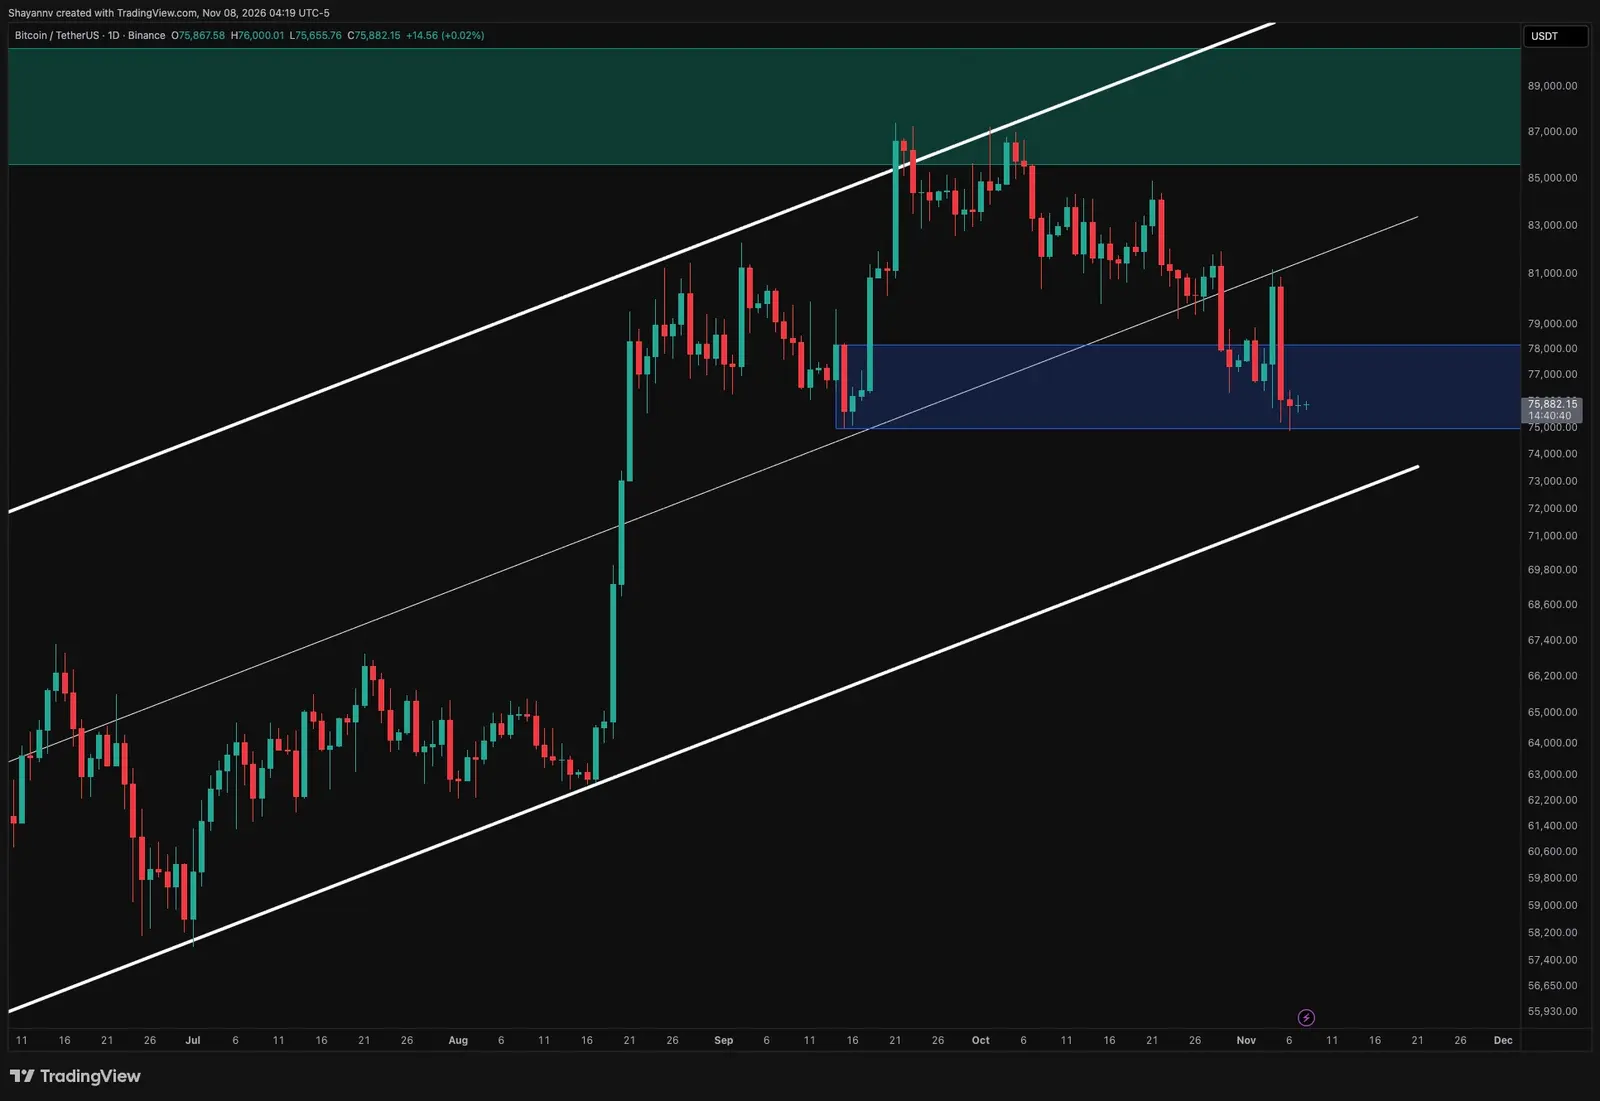
Daily Chart Analysis
Bitcoin cannot break the midpoint of the uptrend channel. A failed reconnection attempt occurred. The recent push to $81,000 ended with a strong bearish candle. This confirms lower successive highs seen in September and October peaks. The asset is near the support range of $75,000 to $78,000. Buyers previously reacted here, but the latest response was weak. Aggressive selling formed small transaction bodies. This suggests temporary stability, not a clear reversal. If the daily close stays below $75,000, this support weakens. A correction could extend to the lower channel limit, estimated at $72,000–$73,000. Alternatively, buyers need to reclaim $78,000 for a better outlook. Reaching $80,000–$81,000 and recovering the channel midpoint signals slowing correction momentum.
Breaking news
 Russia Opens Bitcoin Trading to Retail Investors
 Dogecoin Co-Founder Identifies Weak Demand as Catalyst for Crypto Market Slump
 Dogecoin Bounces Back After Brutal 65% Year-Long Slide
 Bitcoin Miners Face Hardware Shortage as AI Boom Strains Chip Supply
BTC/USDT Four-Hour Analysis
On the BTC/USDT four-hour chart, Bitcoin is in a downtrend channel. The recent rise hit the upper offer limit of $79,800–$82,000. It then reversed abruptly. This rejection confirms sellers defend both the horizontal offer resistance and the downtrend line. The decline moved BTC to the $74,900–$76,300 support zone. Consolidation is happening near the channel's lower limit. This convergence might support a temporary bounce. However, tight consolidation lacks strong underlying support. A steady recovery above $76,300 is the first relief sign. This could lead to the recent consolidation area of $77,000–$78,500. A broader reversal needs BTC to pass the upper channel limit and reclaim $79,800–$82,000. Falling below $74,900 means buyers failed to defend the September support. A break below the downtrend channel could accelerate the drop to the lower daily support.
Derivatives Market Sentiment Analysis
The derivatives volume map shows cooling, neutral, warming, and overheating regimes. Recent observations show warming around $75,800–$76,000. This followed warming near the failed $80,500 recovery. Warming during the current decline suggests increased derivatives participation near support. Volume alone does not confirm new shorts, defensive covers, or buying absorption. The latest bubbles remain in the warming category, not overheating. This activity highlights the current support zone's importance amid bearish price structure. Increased participation with support break confirmation might bring more downside volatility. If buyers reclaim $76,300 with sustained upward momentum, this activity could mark contested support defense. Currently, the bubble map shows an active decision zone. It confirms neither total capitulation nor a bottom formation. This complex analysis requires watching price structure against key support volume growth.