Liquidation Heatmaps Reveal Volatility Traps
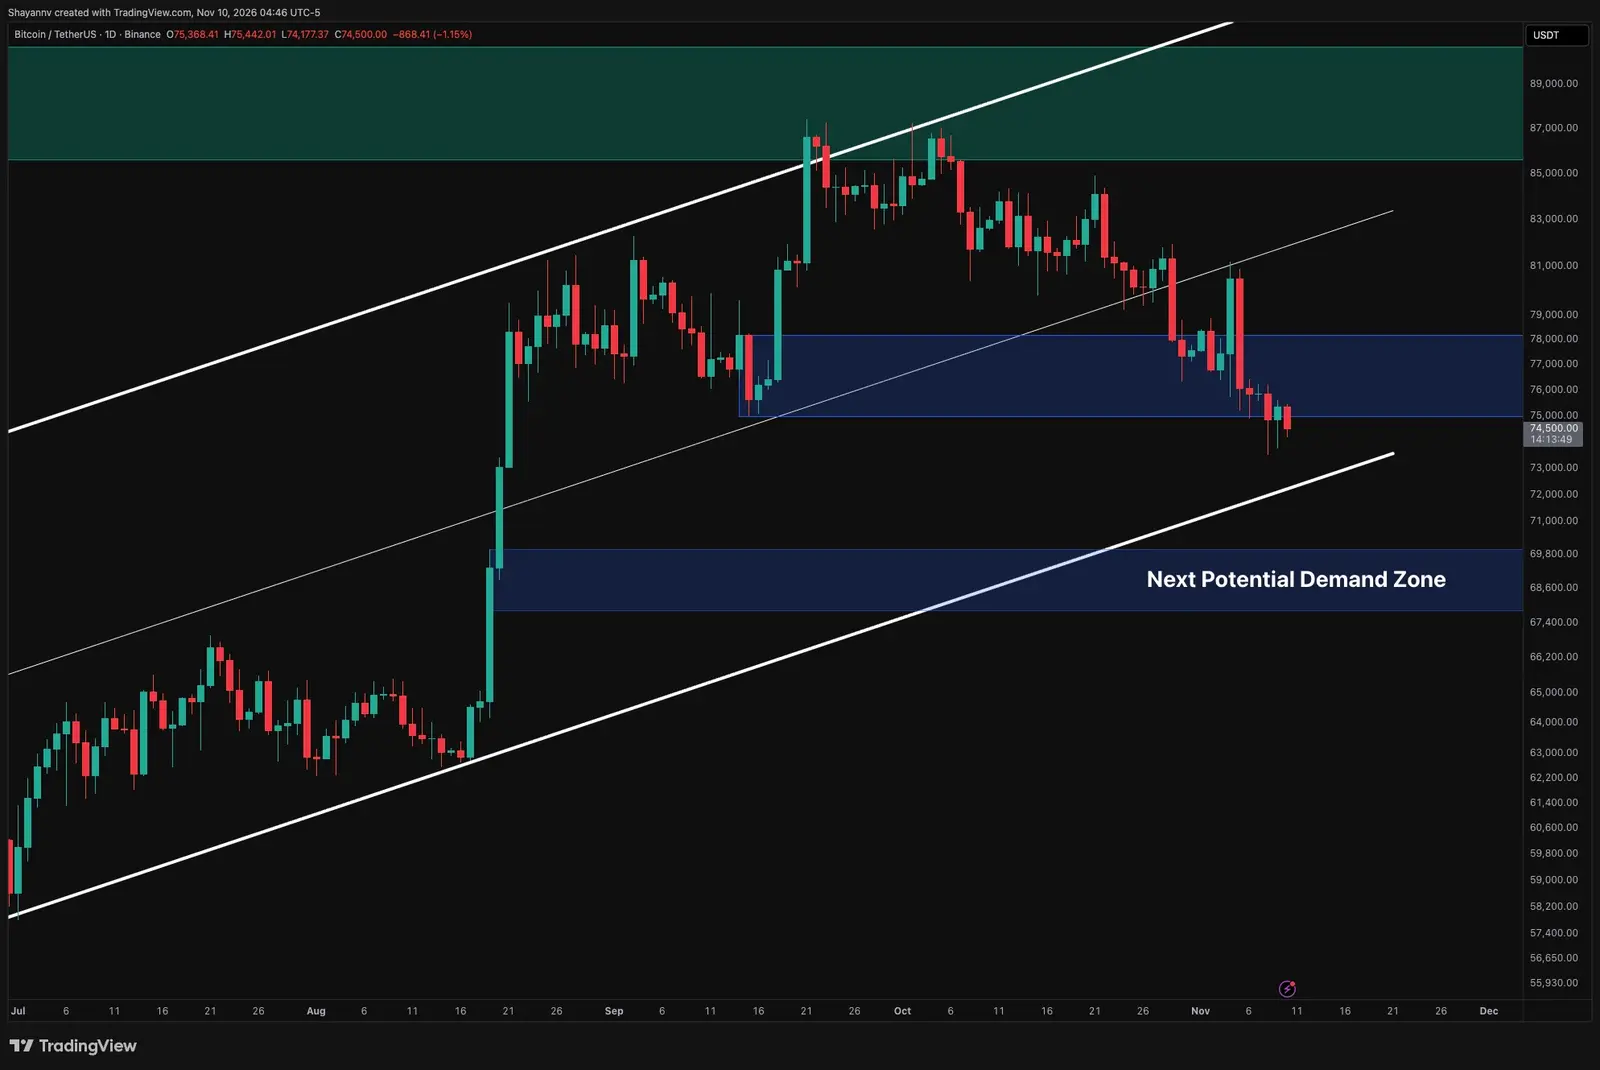
Bitcoin dropped below the $74,000 support level, a move that has left buyers struggling to reassert control near $74,500. The breakdown raises the risk of a deeper correction, and liquidation heatmaps show heavy order concentrations on both sides of the market, amplifying volatility.
Breaking news
 Russia Opens Bitcoin Trading to Retail Investors
 Dogecoin Co-Founder Identifies Weak Demand as Catalyst for Crypto Market Slump
 Dogecoin Bounces Back After Brutal 65% Year-Long Slide
 Bitcoin Miners Face Hardware Shortage as AI Boom Strains Chip Supply
Liquidation heatmaps are a tool traders use to identify where large positions are likely to be forced closed. In the current market, these heatmaps show clusters of liquidations just above and below the current price. When price moves through these zones, forced selling or buying can accelerate the move. For Bitcoin, the concentration near $74,500 means that a small push lower could trigger a cascade of liquidations, pushing price toward the $70,000 level.
Will Bitcoin Crash Below $70,000?
The daily chart shows Bitcoin trading below the $74,000 support, a level that had previously acted as a floor. With sellers in control, the path of least resistance points lower. If the $74,000 level fails to hold, the next major support sits near $70,000. Traders are watching this level closely, as a break below it could open the door to further downside.
The immediate outlook hinges on whether buyers can defend $74,500. If they fail, the liquidation clusters below could drive a rapid decline. Market participants should prepare for heightened volatility in the coming sessions.
What is the current Bitcoin price? Bitcoin is trading below $74,000, with buyers struggling near $74,500.
Frequently Asked Questions
Why is $70,000 a critical level? It is the next major support zone. A break below it could trigger further liquidations and a deeper correction.
What do liquidation heatmaps show? They reveal concentrations of forced liquidations on both sides of the market, indicating where price is likely to move quickly.