Near Protocol (NEAR): A Pause in a Strong Trend
Near Protocol trades around $4.55 on the daily chart. It has been one of the strongest altcoins this year. The price rose from $1.80 in August to nearly $6.00 in mid-October. Since that peak, the price has corrected by about 24%. The decline has been orderly and controlled. Blue and turquoise moving averages sit between $4.30 and $4.40. These levels have supported the price twice in recent days. Buyers have stepped in each time. All major moving averages still point upward. The orange line at $3.60 and the black line at $2.90 are far below the current price. This means the overall trend remains intact.
Breaking news
 Claude AI Forecasts Chainlink Plunge in 2027
 XRP Crashes to $0.87 as ETF Assets Fall Below $1 Billion
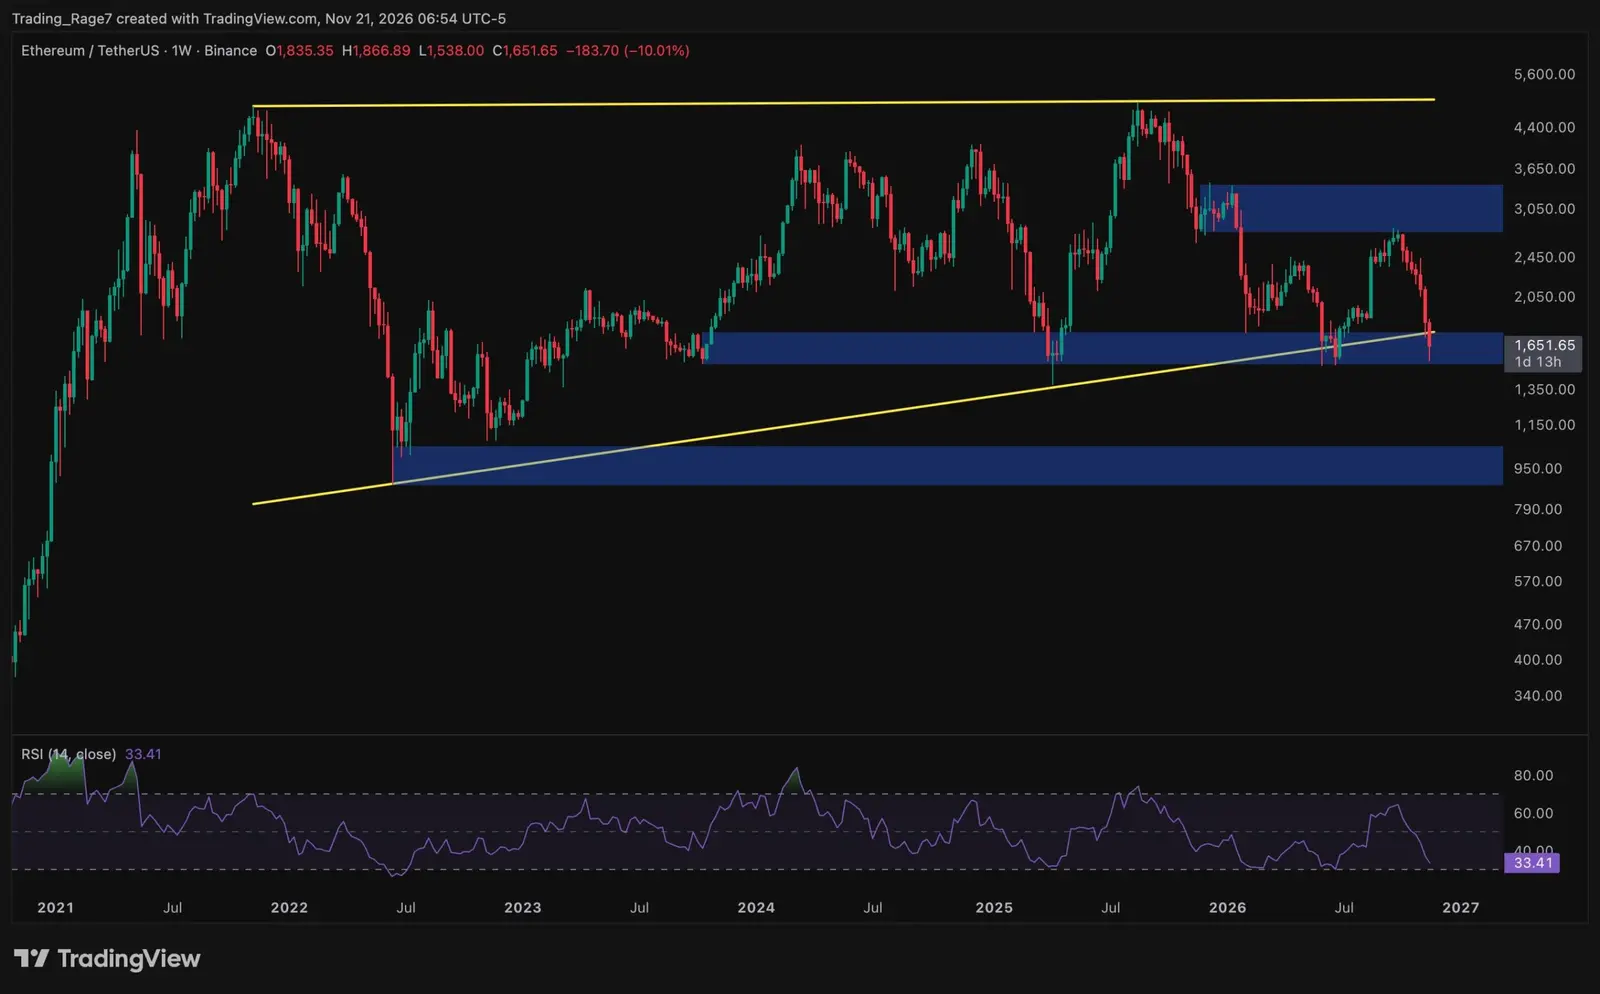 Ethereum price analysis: Did ETH hit its macro bottom after a 30% monthly drop?
 Bitcoin Reclaims $60,000 After Sharp Summer Selloff
The main weakness is volume. It has dropped from early October peaks. Recent candles show little buying power. The RSI indicator sits at about 48, down from overbought levels in September. This means the market has cooled without turning bearish. The first resistance for NEAR is the green line at $4.75, followed by $5.20. A move above $5.60 would open the path back to $6.00, the recent peak. On the downside, $4.30 is the key level to hold. If it breaks, the next support lies at about $3.60, where the orange moving average waits. For now, NEAR looks like a strong coin taking a pause. As long as it stays above $4.30, the uptrend remains alive. A return of volume would be the first signal that the next rally is starting.
Shiba Inu (SHIB): Sellers Hold the Line
Shiba Inu trades at 0.00000491 on the daily chart. It sits below both major moving averages. The orange and blue lines, located at 0.00000520 to 0.00000523, act as the first barrier. The long-term black line at 0.00000555 is far above the price, showing how weak the trend remains. Every rally since early October has failed at these levels. SHIB hit a peak near 0.00000620 in late September and has fallen since. Recent candles are small, indicating neither buyers nor sellers have control. Support lies at about 0.00000476, where the price has stopped declines multiple times. A break below this level could send SHIB toward 0.00000450 and then 0.00000430. These levels correspond to early summer lows. Volume has dropped to some of the year's lowest levels, signaling fading investor interest. The RSI is around 40, which is weak but not oversold.
This means there is still room for further decline before the market looks stretched. To change the picture, SHIB must close above 0.00000520 with rising volume. That would be the first real recovery signal. A move above 0.00000555 would be even stronger, as it would break the long-term trend line. Until then, any rally looks like a quick bounce in a downtrend. Traders must closely watch the floor at 0.00000476, as losing it could open the door to a deeper drop.
Chainlink (LINK): Key Support Tested After a Sharp Correction
Chainlink trades at about $11.50 on the daily chart. The coin rose from about $7.00 in early July to nearly $15.80 in late September, a gain of over 100%. Since that peak, the price has fallen by about 27% and now sits on a critical support zone. The orange moving average at $11.50 supports the price right now. Below it, the long-term black line at $11.00 acts as a second safety net. Both lines indicate an upward direction, meaning the larger trend has not yet broken. Above the price, the blue line at $12.20 and the turquoise line at $12.65 form the main resistance zone. Every rally in October has failed at these levels. Volume is not shown on this chart, but candles have become small, indicating a lack of strong buyers and sellers. The RSI sits at about 38, close to the oversold zone.
This means selling has become stretched and a quick bounce is possible. The key level to hold is $11.00. If LINK closes below this, the next support lies at about $10.50, where the coin found a floor in mid-September. A decline below that would target $9.80 and then $9.20. These are the lows from early July. For a recovery, LINK needs to close above $12.20 with volume. That would signal the end of the correction. A move above $12.65 would confirm the uptrend is resuming. Until then, the coin remains in a consolidation phase. Traders should monitor the $11.00 level closely, as a break would confirm the downtrend is continuing.