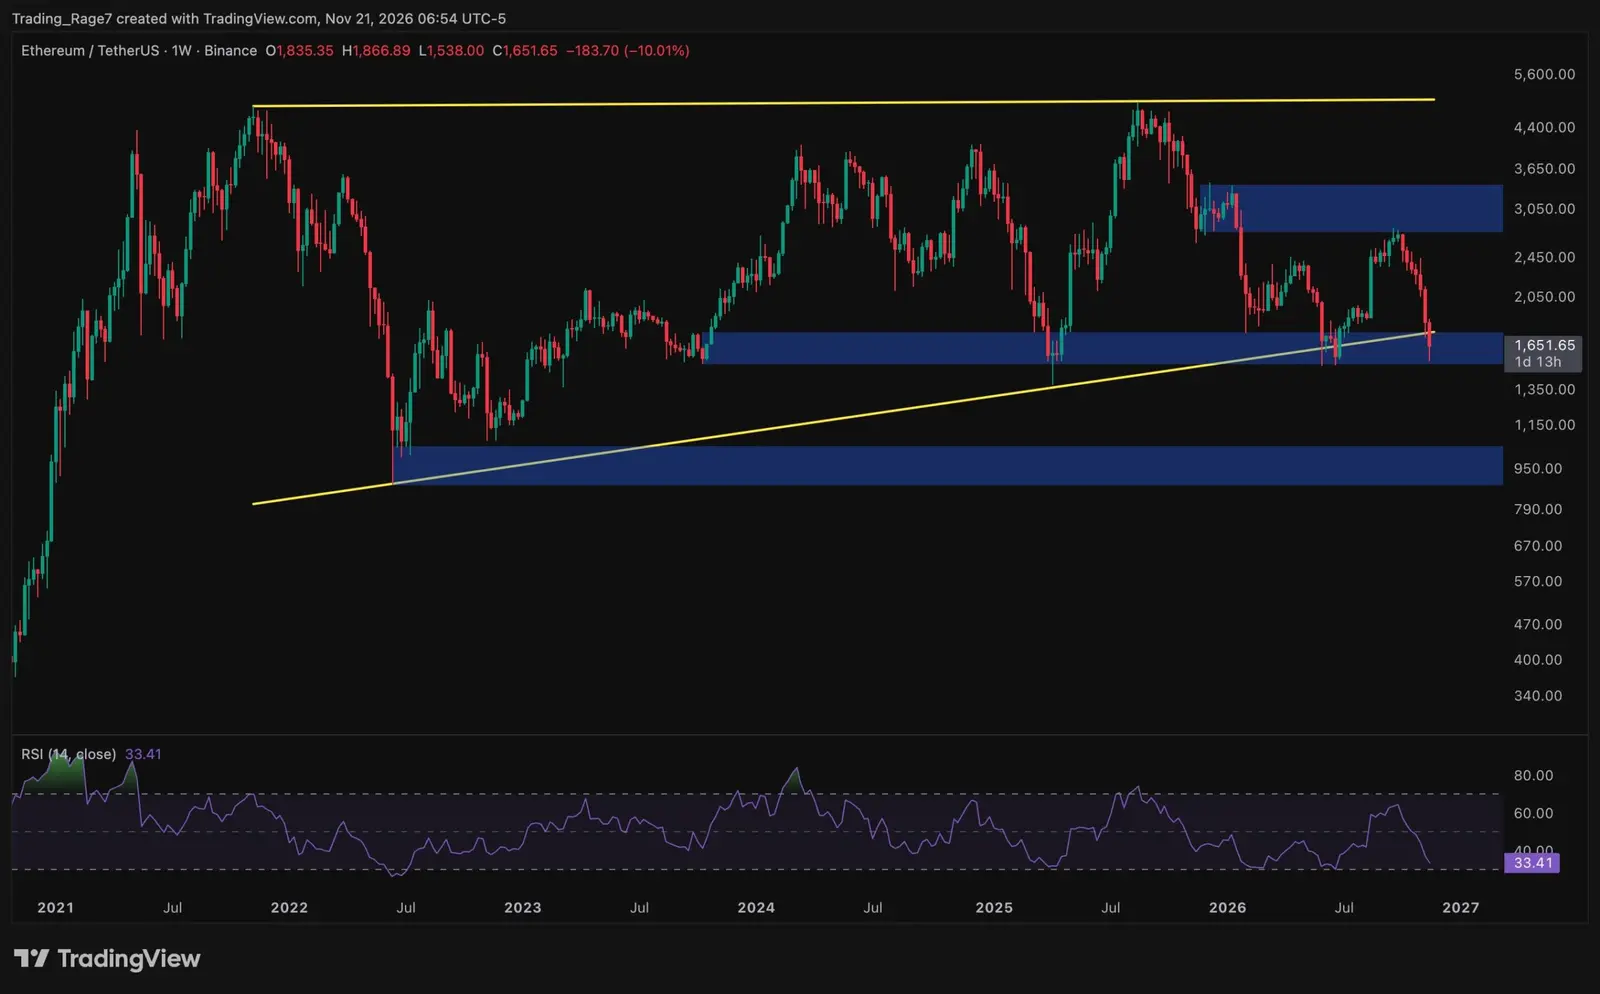
Market Data Reveals Broad-Based Altcoin Decline
A broad group of alternative cryptocurrencies has experienced severe price declines in recent months. Specifically, twenty-seven distinct digital assets have lost more than half of their value. This downturn is measured against the market peak reached in October 2025. Analysts are currently tracking these trends within a larger comparison of forty major assets. Many traders believe the selling pressure may have finally exhausted itself. Consequently, they are starting to predict that the market has found its lowest point following the sharp drop in November.
Breaking news
 Dogecoin Bounces Back After Brutal 65% Year-Long Slide
 Bitcoin Miners Face Hardware Shortage as AI Boom Strains Chip Supply
 Claude AI Forecasts Chainlink Plunge in 2027
 XRP Crashes to $0.87 as ETF Assets Fall Below $1 Billion
The financial landscape for non-Bitcoin cryptocurrencies has turned significantly negative. A detailed review of market performance highlights the extent of this correction. Since the high point in late autumn, a substantial portion of the altcoin sector has struggled. The decline is not limited to a few weak projects but spans a wide range of established tokens. Investors who held these assets through the summer rally have seen their portfolios shrink dramatically. The data indicates that this was a systemic pullback rather than an isolated event affecting only specific sectors.
Is the November Sell-Off Marking the Cycle Low?
Traders are closely monitoring volume patterns and support levels to confirm this theory. The November sell-off triggered significant liquidations across various exchanges. However, recent trading activity suggests that panic selling may be subsiding. Market participants are looking for signs of accumulation by long-term holders. If these signals persist, it could mark the beginning of a recovery phase. The current sentiment remains cautious but increasingly optimistic among active day traders.
How many altcoins have lost more than 50% in value?
Determining the exact bottom of a bearish phase is notoriously difficult. Yet, several technical indicators now align with bullish predictions. The fifty percent loss threshold often serves as a psychological barrier for investors. Once this level is breached, fear typically drives further selling. Now that this threshold has been crossed for so many assets, the worst may be behind the market. Some analysts argue that the market structure is resetting for a new upward leg.
The upcoming weeks will test this hypothesis decisively. If prices stabilize near current levels, it supports the bottom-finding narrative. Conversely, a break below recent lows would invalidate the current bullish case. Traders are preparing for both scenarios while managing their risk exposure. The focus remains on whether liquidity can return to support higher valuations.
When did this significant price decline begin?
Twenty-seven specific tokens have dropped by over half their value. This metric is based on a comparison of forty major digital assets. The timeframe extends from the October 2025 peak to the present.
Why are traders calling a bottom now?
The downturn started immediately after the market peaked in October 2025. The most intense selling pressure occurred during the month of November. This period marked the sharpest contraction in asset values.
Traders observe that the most severe selling occurred in November. Recent stabilization in prices suggests that heavy selling pressure is fading. This leads to the belief that the market has reached a local minimum.