
Assessing Potential Downward Targets
Bitcoin dropped to $67,500 on Friday, marking a significant shift in market momentum. The cryptocurrency slipped beneath its 200-week simple moving average, a key technical indicator it had maintained since mid-August. This decline below $68,000 represents the first time the asset has tested this specific trend line in nearly three months.
Breaking news
 Claude AI Forecasts Chainlink Plunge in 2027
 XRP Crashes to $0.87 as ETF Assets Fall Below $1 Billion
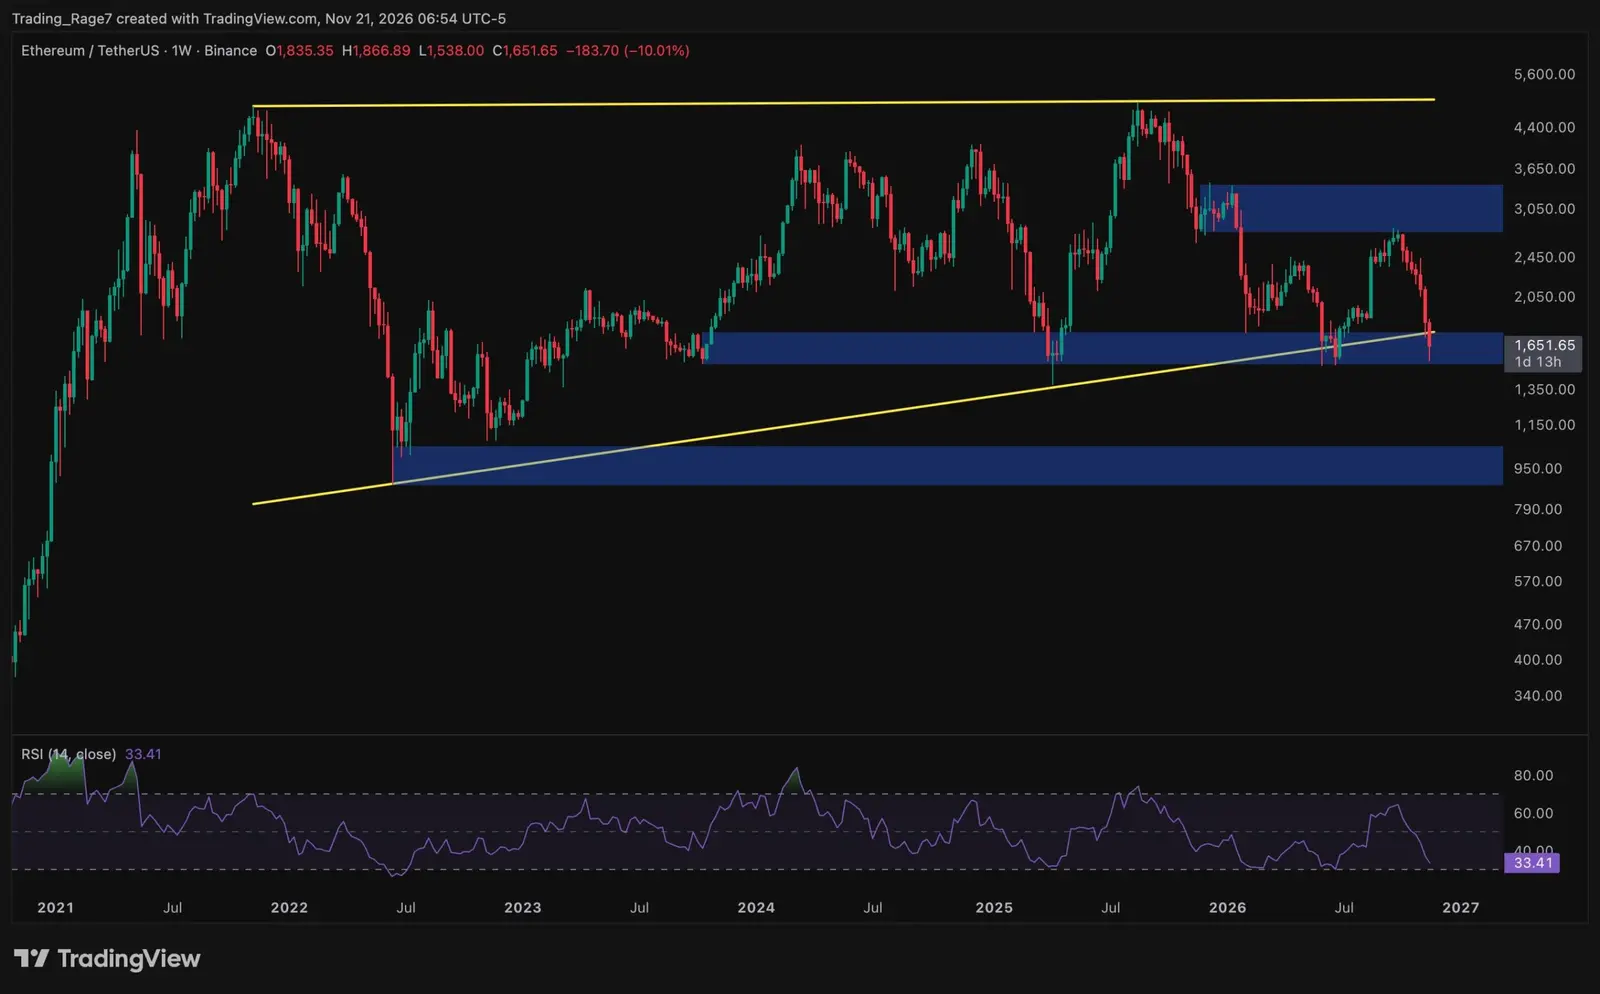 Ethereum price analysis: Did ETH hit its macro bottom after a 30% monthly drop?
 Bitcoin Reclaims $60,000 After Sharp Summer Selloff
The 200-week moving average is widely viewed by traders as a baseline for long-term market health. Falling below this threshold often signals a weakening of investor sentiment and potential bearish pressure. Analysts are now closely monitoring the price action to see if the asset can reclaim this level or if further losses are imminent.
Market observers are already calculating the risks associated with this recent breakdown. Some analysts suggest that the current technical structure leaves the door open for a deeper correction. Projections indicate that the price could potentially slide toward the $57,700 mark if selling pressure intensifies in the coming sessions.
Will the Market Find New Support?
The sudden dip highlights the volatility inherent in the current digital asset landscape. While the market has seen periods of relative stability recently, the breach of this moving average suggests that support levels are being actively challenged. Traders remain cautious as they look for signs of a recovery or further consolidation.
The immediate future of Bitcoin depends on its ability to stabilize above current levels. If the price fails to regain the 200-week average quickly, it could trigger a broader sell-off among short-term holders. Conversely, a swift rebound would likely restore confidence and invalidate the bearish outlook currently circulating among market analysts.
Investors are now preparing for increased turbulence as the asset navigates this critical technical juncture. The coming days will be vital in determining whether this dip is a temporary setback or the start of a more sustained downward trend. Market participants are advised to monitor volume and price action for clearer signals.
Frequently Asked Questions
What is the significance of the 200-week moving average? It is a widely tracked technical indicator used to identify long-term price trends. Falling below this line is often interpreted as a sign of potential weakness.
Could Bitcoin drop to $57,700? Some analysts have identified this figure as a potential target for the next phase of the correction. This remains a speculative projection based on current technical charts.
What should investors watch for next? Observers should look for signs of a price recovery back above the 200-week average. A failure to reclaim this level may suggest that further downward movement is likely.