Analysts Eye Potential Drop Toward $50,000
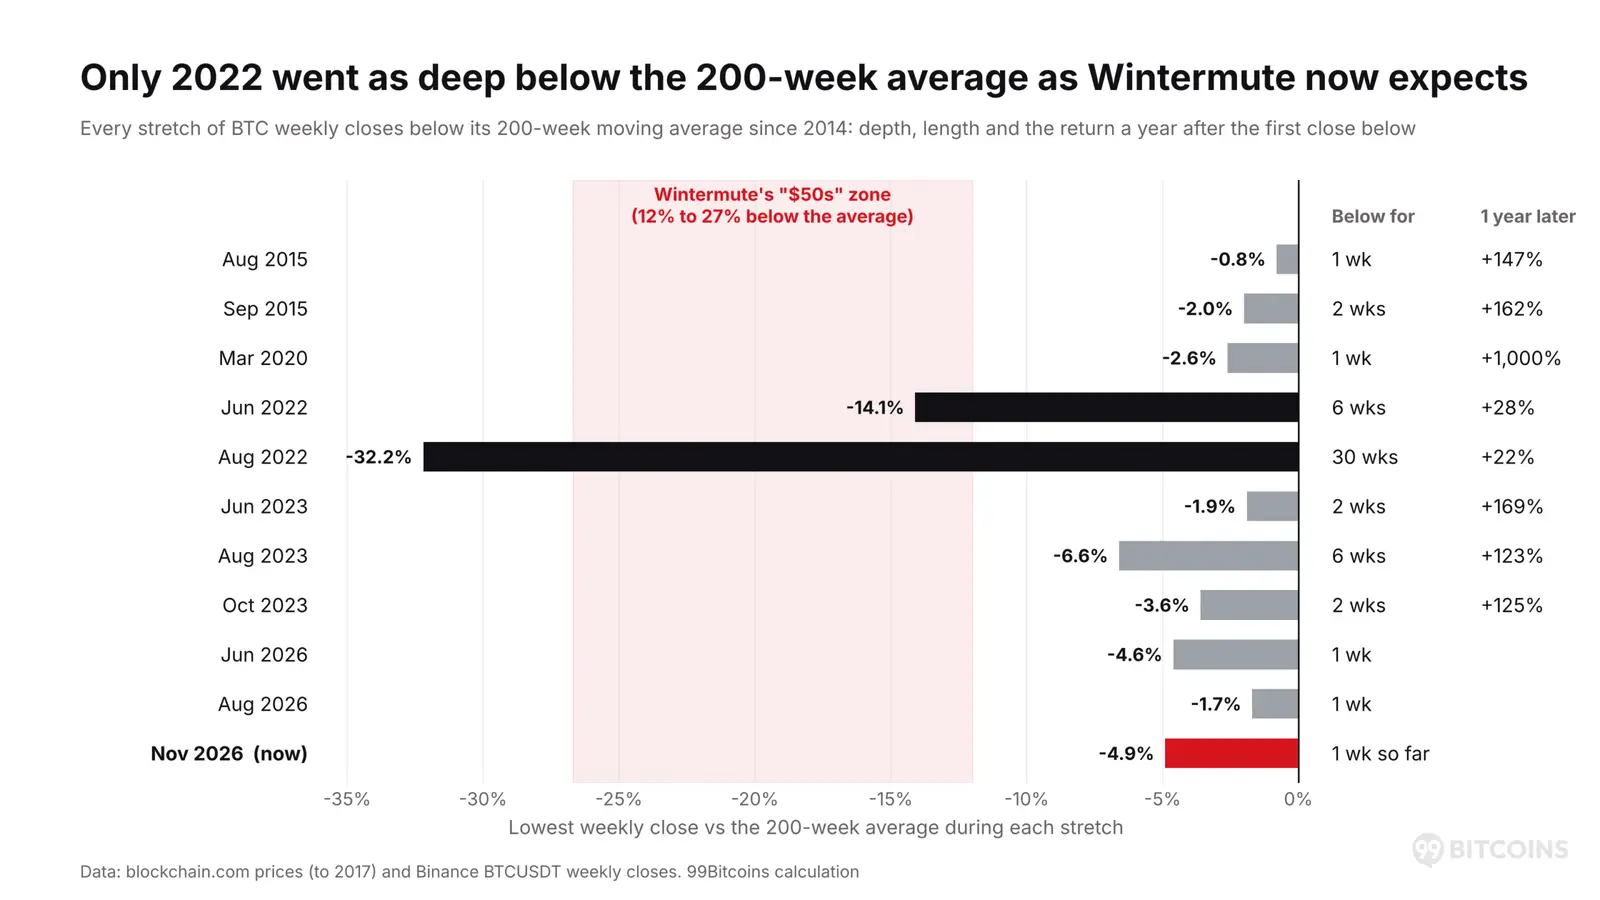
Bitcoin closed at $65,351 last week, marking its first time below the 200-week moving average since August 2022. This technical milestone occurred on Monday, November 16, signaling a potential shift in market sentiment. Traders are now watching closely for further downward momentum in the cryptocurrency market.
Breaking news
 Claude AI Forecasts Chainlink Plunge in 2027
 XRP Crashes to $0.87 as ETF Assets Fall Below $1 Billion
 Ethereum price analysis: Did ETH hit its macro bottom after a 30% monthly drop?
 Bitcoin Reclaims $60,000 After Sharp Summer Selloff
The 200-week moving average represents the average weekly closing price over roughly four years. For Bitcoin, this critical line sits near the $68,000 mark. Breaking below this level often indicates a transition from a long-term bullish trend to a bearish phase. Market participants view this metric as a vital gauge of overall health and momentum.
Wintermute, a major market maker, issued a warning on Monday. The firm expects continued selling pressure that could push prices into the $50,000 range. This prediction aligns with broader concerns about liquidity and investor confidence. River, a specialized Bitcoin broker, highlighted specific technical indicators supporting this bearish outlook.
Is Now a Historic Buying Opportunity?
Traders are analyzing recent volume spikes alongside price action. A sustained close below the 200-week average often triggers algorithmic sell orders. These automated systems can accelerate declines when key support levels fail. Investors are currently reassessing their risk exposure in light of these signals.
Historical patterns suggest that deep drawdowns often precede significant rallies. Some analysts argue that current valuations present a favorable entry point for long-term holders. Others caution that catching a falling knife remains risky without clear bottom signals. The debate continues among institutional and retail investors alike.
Frequently Asked Questions
Support levels around $60,000 are now under intense scrutiny. If Bitcoin holds this floor, the drop may prove temporary. Conversely, a break below could open the door to lower targets. Market makers are adjusting their order books to manage volatility during this uncertain period.
What is the 200-week moving average? It is the average of Bitcoin’s weekly closing prices over the past four years. It serves as a long-term trend indicator for traders.
Why did Wintermute predict a drop to $50,000? The firm cited expected selling pressure following the breach of key support levels. They anticipate further downside until new equilibrium is found.