Long-Term Perspective Overcomes Short-Term Volatility
Pseudonymous analyst DonAlt has declared that one specific chart represents the definitive guide for Bitcoin investors. This assertion follows a volatile period where the leading cryptocurrency briefly dipped below the $80,000 mark. The strategist argues that short-term noise often misleads market participants during such dips. He urges holders to ignore immediate price fluctuations and focus instead on broader structural trends.
Breaking news
 Dogecoin Co-Founder Identifies Weak Demand as Catalyst for Crypto Market Slump
 Dogecoin Bounces Back After Brutal 65% Year-Long Slide
 Bitcoin Miners Face Hardware Shortage as AI Boom Strains Chip Supply
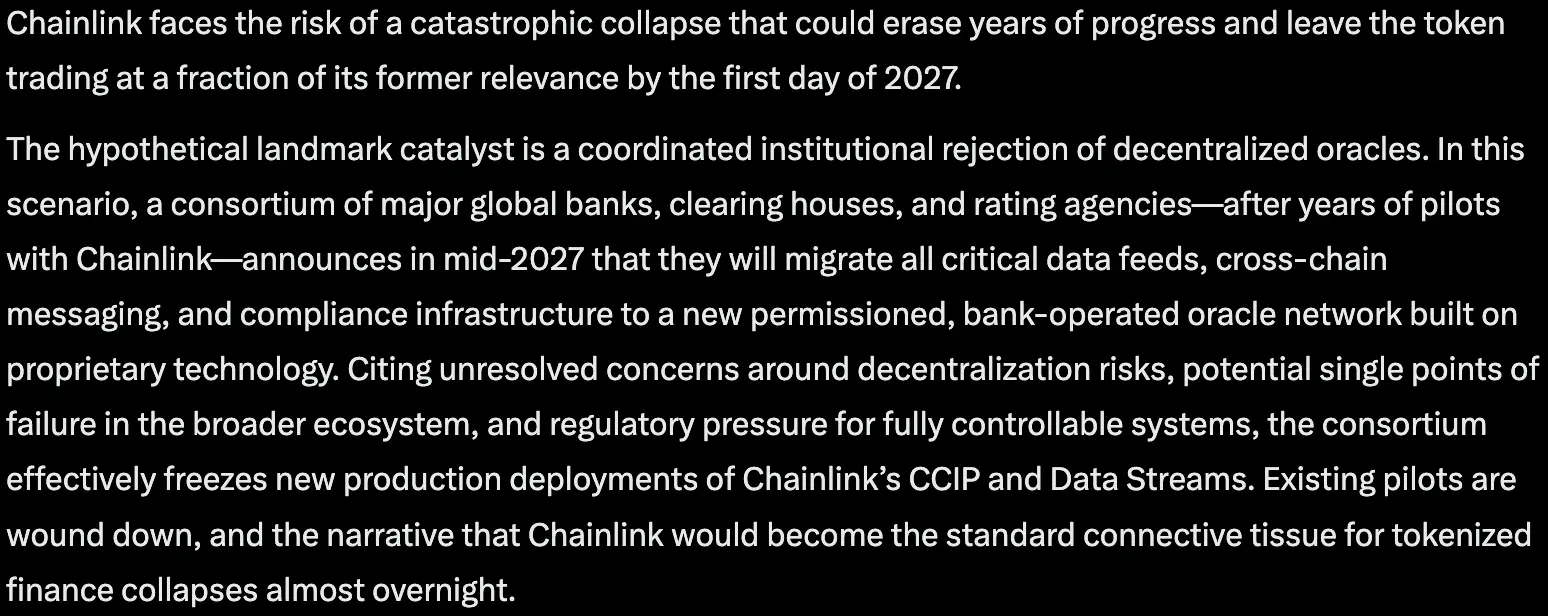 Claude AI Forecasts Chainlink Plunge in 2027
DonAlt, who gained significant recognition for accurately predicting the 2026 Bitcoin bottom, shared this perspective on X. His audience consists of thousands of active traders and long-term holders. The core of his argument rests on the concept of timeframes. He suggests that zooming out reveals a clearer picture of asset strength compared to daily or hourly views. This approach aims to reduce emotional decision-making during periods of heightened volatility.
Does One Chart Truly Dictate Market Direction?
The analyst emphasizes that Bitcoin’s recent movement below $80,000 does not signal a fundamental break in its upward trajectory. Instead, he frames this dip as a normal consolidation phase within a larger cycle. By looking at multi-year charts, investors can identify support levels that remain intact despite temporary sell-offs. DonAlt’s previous success in calling the 2026 bottom lends credibility to his current methodology. Traders are encouraged to align their strategies with this macro view rather than reacting to every minor price swing.
This strategy requires patience and discipline. It involves holding assets through temporary drawdowns while waiting for the long-term trend to reassert itself. The only chart that really mattersrefers to this extended timeframe visualization. It filters out market noise and highlights the true momentum of the digital asset. For many investors, this simplifies their decision-making process significantly.
Critics might argue that relying on a single visual tool oversimplifies complex market dynamics. However, DonAlt maintains that clarity beats complexity when assessing long-term value. The question remains whether this singular focus provides enough nuance for active trading strategies. Most passive investors find comfort in this streamlined approach. It removes the need for constant monitoring of multiple indicators. The focus shifts entirely to the integrity of the primary trend line.
Frequently Asked Questions
Why did DonAlt emphasize the $80,000 level? This price point marked a recent brief breach that triggered concern among traders. DonAlt used it as a case study to demonstrate why long-term charts show resilience. The dip serves as a practical example of his recommended analytical framework.
What makes this specific chart superior to others? It displays Bitcoin's performance over an extended period, smoothing out daily volatility. This allows investors to see the underlying strength of the asset clearly. It reduces the impact of short-term market sentiment on investment decisions.