
Exchange Outflows Signal Stronger Holder Confidence
Ethereum trading volume on the world’s largest cryptocurrency exchange has plummeted to its lowest level in seven months. This significant drop in liquidity occurred while total Ethereum reserves held on Binance continued their steady decline. The trend persists despite recent periods of high market volatility that typically attract active trading. Analysts are closely monitoring these metrics as they often signal shifts in holder sentiment and potential price movements.
Breaking news
 Ontology Halts L1 Blockchain for 41 Hours Over an Unknown Threat
 Ethereum Visionary V. Buterin Announces 2030 Upgrade Roadmap
 Bitcoin Shows Early Bullish Signs Despite Struggle to Surpass $84,000
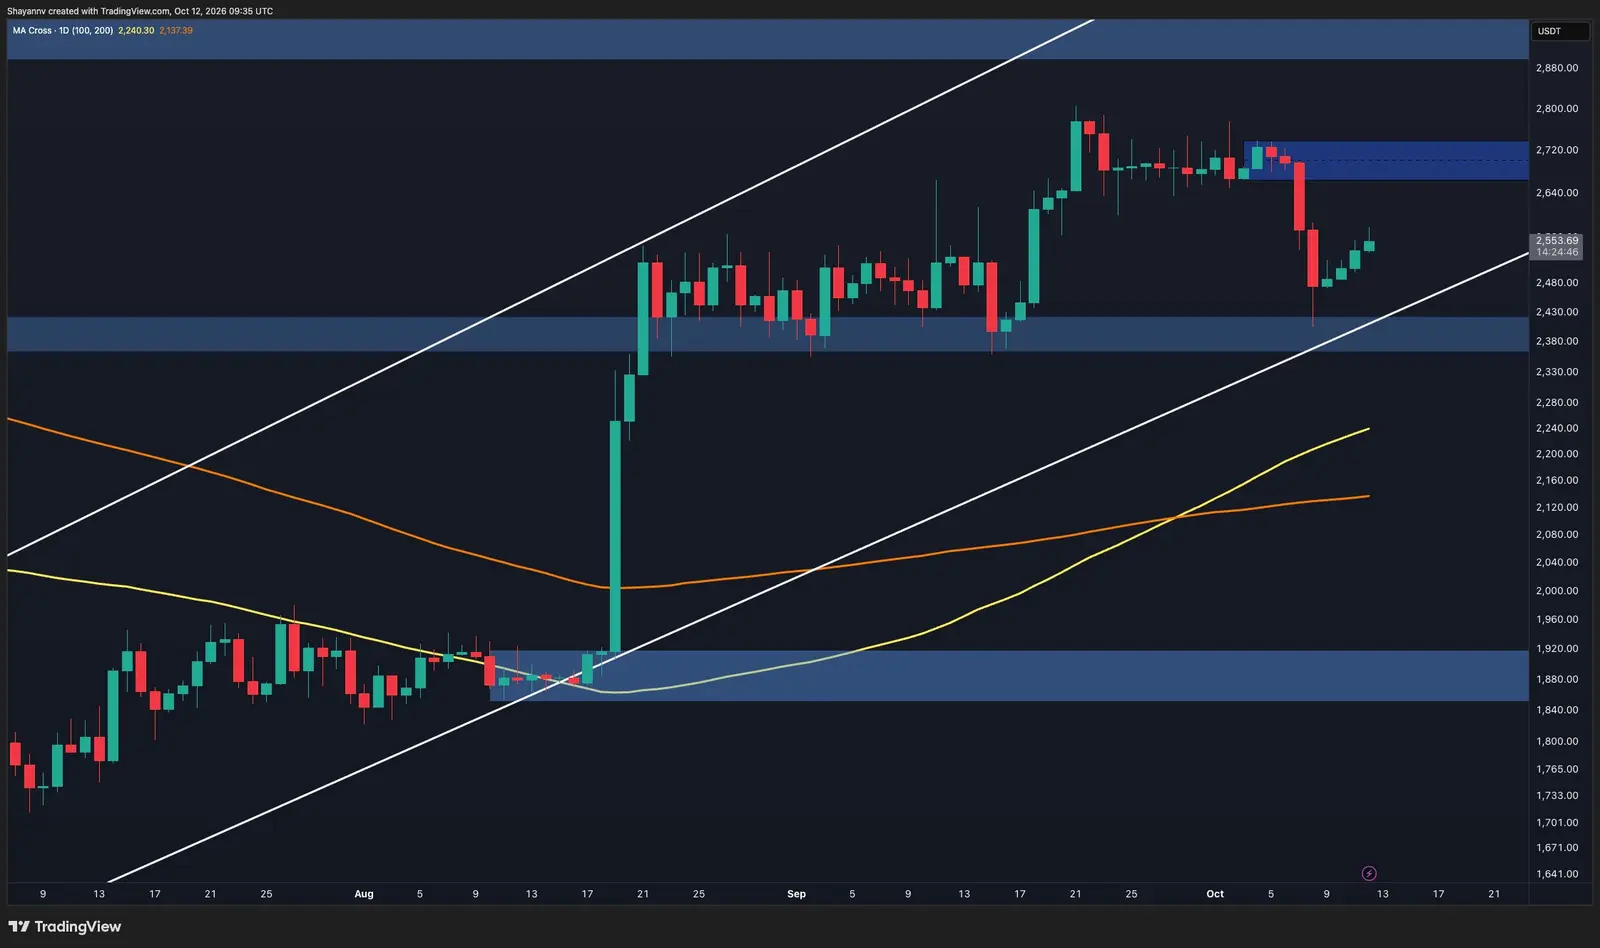 Ethereum Eyes $2.55K After Recent Sell‑Off
The primary indicator driving this narrative is the Z-Score metric, which measures current price against historical averages. For Ethereum on Binance, this score has fallen to -1.00. A negative reading suggests that current prices are trading below the long-term mean. Such conditions often correlate with reduced buying pressure or increased selling activity. Traders interpret these signals to gauge whether the asset is undervalued or facing fundamental headwinds. The sustained outflow of coins from exchange wallets reinforces the theory that holders are moving assets to cold storage.
Does Thin Liquidity Portend a Price Breakout?
When crypto assets leave major exchanges, it usually indicates that investors are securing their holdings in private wallets. This behavior reduces the immediate supply available for sale on the open market. Consequently, lower liquidity can sometimes lead to sharper price swings when large orders enter the order book. In this specific case, the combination of falling reserves and a negative Z-Score creates a complex picture. While reduced supply might support long-term price stability, low liquidity increases short-term risk. Market participants must balance the bullish signal of accumulation against the friction caused by thinner trading books. The data suggests a shift from speculative trading to longer-term holding strategies among institutional and retail investors alike.
Historical patterns show that extreme liquidity drops often precede significant directional moves. When trading activity dries up, even modest buy or sell orders can trigger substantial price changes. This volatility can benefit traders who anticipate the next move but risks catching those caught off guard. The current -1.00 Z-Score implies that Ethereum is currently trading in a depressed zone relative to its history. If demand suddenly spikes, the limited sell-side liquidity could fuel a rapid upward correction. Conversely, if selling pressure mounts, the lack of buyers may accelerate the decline. Investors are watching closely to see which scenario plays out in the coming weeks.
The outlook for Ethereum remains tied to these on-chain metrics. As long as reserves continue to drain from Binance, the underlying supply dynamics favor holders over sellers. However, market makers and traders will likely widen bid-ask spreads to account for the increased risk. This environment demands patience from long-term investors but offers opportunities for agile short-term traders. The next few days will be critical in determining if the current trend reverses or continues.
Frequently Asked Questions
What does a Z-Score of -1.00 indicate for Ethereum? A score of -1.00 means the current price is one standard deviation below the historical average. This statistical measure suggests the asset is trading at a discount compared to its typical range.
Why do falling exchange reserves matter for liquidity? Lower reserves mean fewer coins are readily available for trading on the platform. This reduction in available supply directly contributes to thinner trading volumes and lower overall liquidity.