
Technical Landscape: Resistance Zones and Momentum Gaps
On Sunday, October 18, Bitcoin’s price settled around $81,600, just shy of the $81,500 mark that analysts flagged as a critical threshold. The cryptocurrency’s weekly chart shows a modest gain, but technical indicators suggest the rally could stall unless buying pressure intensifies before the week ends. Traders are watching key resistance levels and volume trends to gauge whether the digital asset can break higher or slip back toward earlier lows.
Breaking news
 Bitcoin Miners Face Hardware Shortage as AI Boom Strains Chip Supply
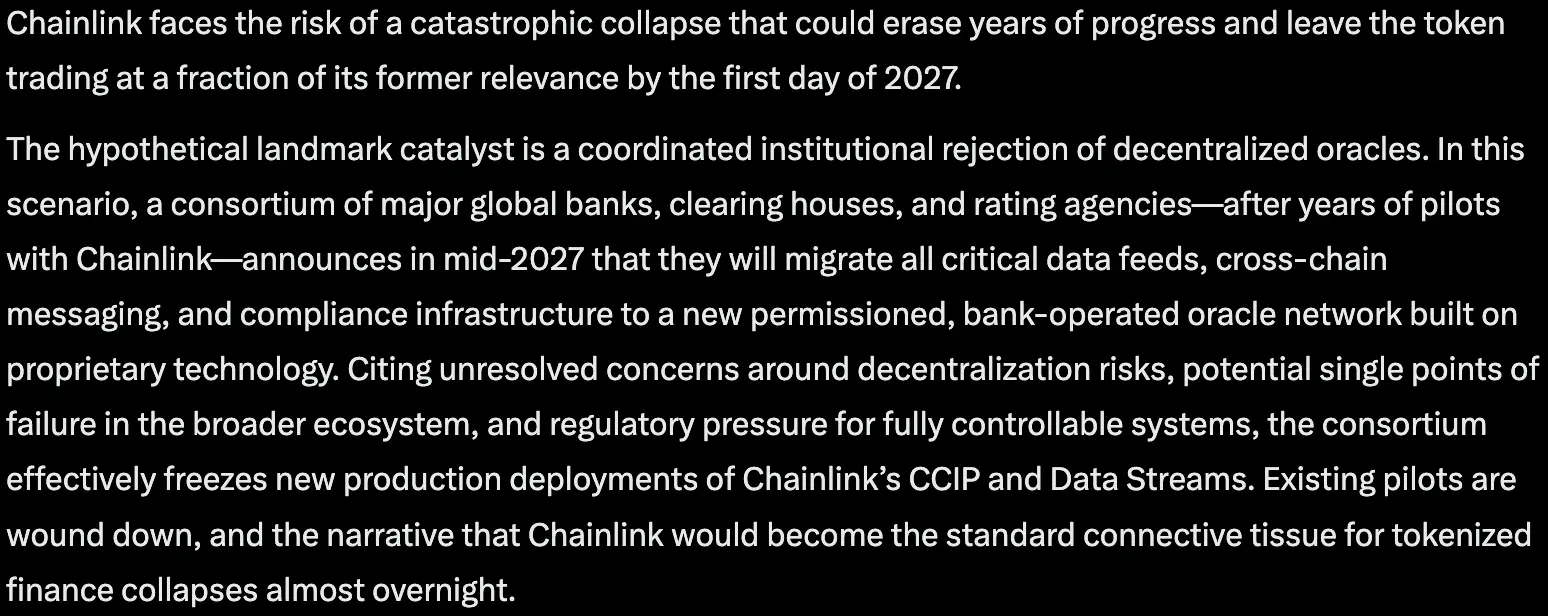 Claude AI Forecasts Chainlink Plunge in 2027
 XRP Crashes to $0.87 as ETF Assets Fall Below $1 Billion
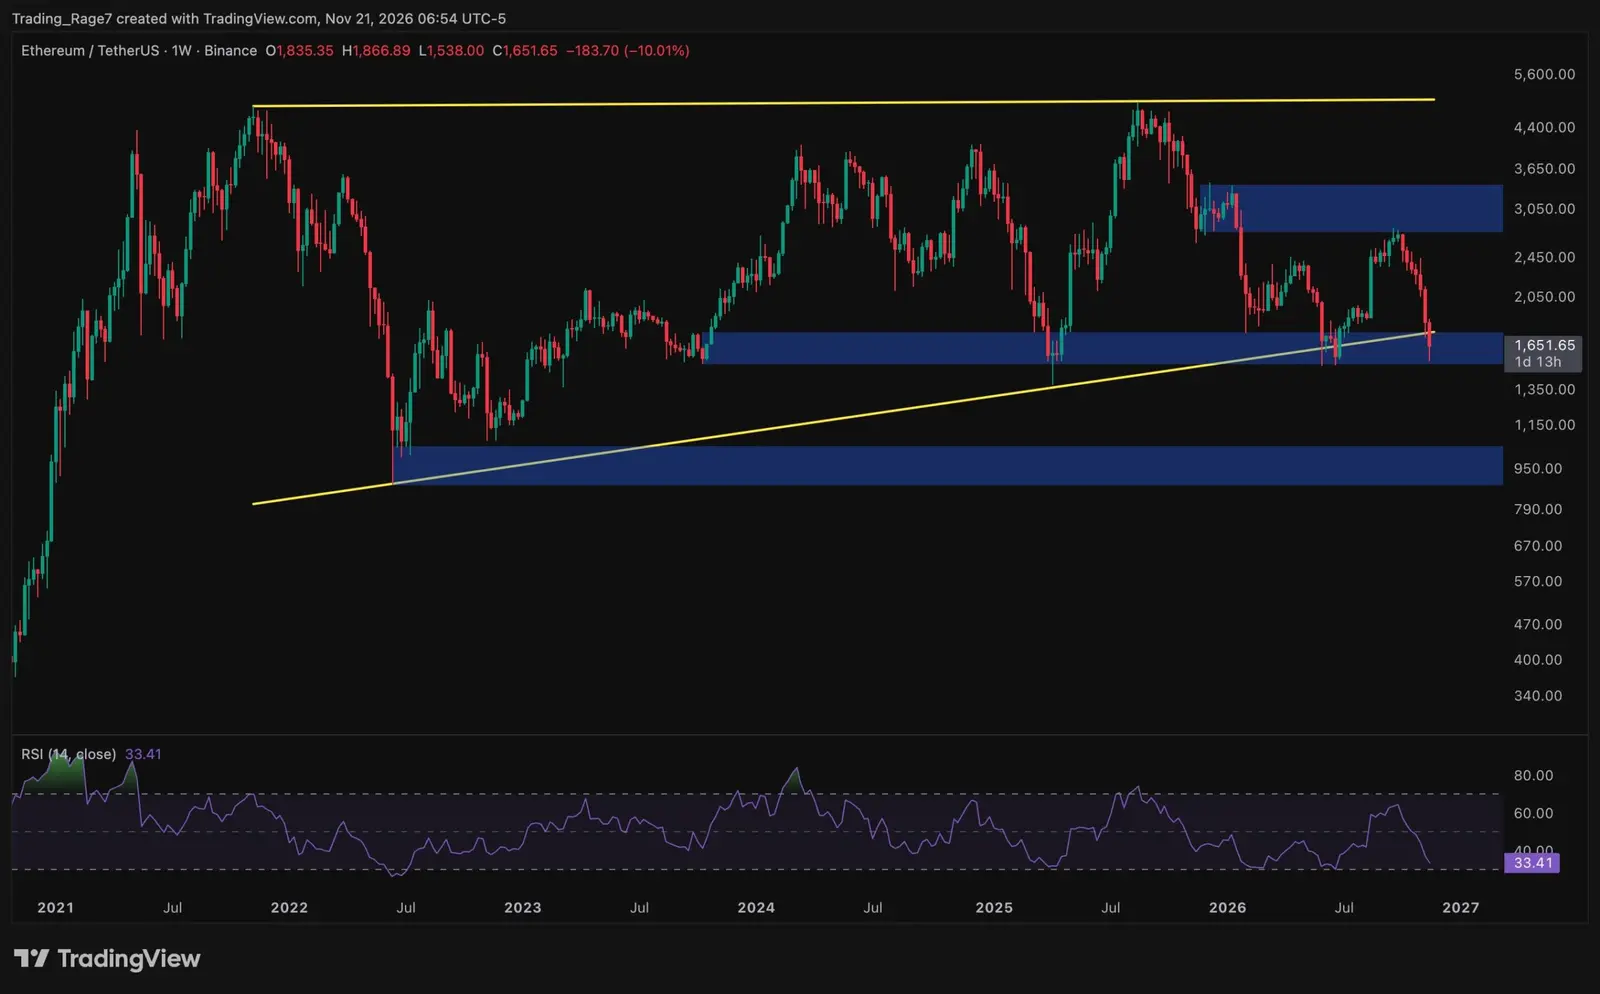 Ethereum price analysis: Did ETH hit its macro bottom after a 30% monthly drop?
The latest price movement reflects a blend of market optimism and lingering caution. After a volatile month that saw Bitcoin swing between $78,000 and $84,000, the current level sits near a short‑term pivot point identified by moving‑average convergence divergence (MACD) and relative strength index (RSI) readings. Both metrics hint at a neutral stance, implying that momentum is not yet decisive. Analysts point to dwindling buying volume on the exchange side and a modest rise in open interest on futures contracts as signs that the market may need a catalyst—such as positive regulatory news or a surge in institutional demand—to push the price beyond the $82,000 ceiling.
The $81,500 level aligns with the 20‑day exponential moving average, a line many traders use to gauge short‑term trends. A breach above this average could trigger algorithmic buying, adding fuel to the rally. However, the next major resistance sits near $84,000, a zone that previously halted a similar uptrend in early September. Should Bitcoin fail to clear $81,500, the price may retreat to the $78,000 support band, a level that held firm during the market’s correction in late August.
Will Bitcoin’s Weekly Close Spark a Bigger Rally?
Market sentiment surveys reveal a modest bullish tilt, with roughly 55 % of respondents expecting further gains in the next 30 days. Yet, the same surveys note heightened concern over potential macroeconomic headwinds, including lingering inflation pressures and central‑bank policy shifts. These factors could dampen risk appetite, limiting the inflow of new capital into crypto assets.
The pressing question for investors is whether the upcoming weekly close can act as a springboard for a sustained rally. Historical data shows that Bitcoin often experiences a „week‑end effect,” where price action on Sundays can set the tone for the following trading days. If the market closes above $81,500 with strong volume, technical analysts argue that the bullish narrative could gain credibility, encouraging more traders to enter long positions. Conversely, a close below this threshold might reinforce a cautious stance, prompting profit‑taking and a possible slide toward the $78,000 support zone.
In the short term, market participants are also watching the upcoming U. S. economic data releases, including employment figures and consumer price index reports. Positive outcomes could buoy risk assets, including Bitcoin, while disappointing numbers might trigger a flight to safety, pressuring the cryptocurrency lower.
Overall, Bitcoin’s trajectory hinges on a blend of technical triggers and broader economic signals. A decisive move above $81,500 could unlock higher momentum, but without clear buying pressure, the asset may linger in a narrow range, awaiting fresh catalysts.
Frequently Asked Questions
What does a close above $81,500 mean for Bitcoin’s price? A close above that level, especially with high trading volume, would likely be seen as a bullish signal, potentially attracting more buyers and pushing the price toward the next resistance around $84,000.
How important are macroeconomic reports for Bitcoin’s short‑term outlook? Economic data such as inflation and employment numbers influence investor risk appetite. Positive reports can lift risk‑on assets like Bitcoin, while negative data may cause investors to pull back, weighing on the price.
Is the $78,000 zone still a reliable support level? Yes, recent price action has shown that Bitcoin tends to find buying interest near $78,000, making it a key floor that could hold if the market turns bearish.