
Accumulation Signals Resurface Amid Cooling ETF Appetite
Bitcoin failed to break the $87,000 barrier on Tuesday, prompting a sharp decline in its market‑value‑to‑realized‑value (MVRV) ratio. The on‑chain metric, highlighted by analyst Darkfost, slipped beneath the 30th percentile, a level traditionally associated with the start of an accumulation phase. The drop comes as institutional interest in spot ETFs appears to be waning, while long‑term holders remain cautious.
Breaking news
 Bitcoin Miners Face Hardware Shortage as AI Boom Strains Chip Supply
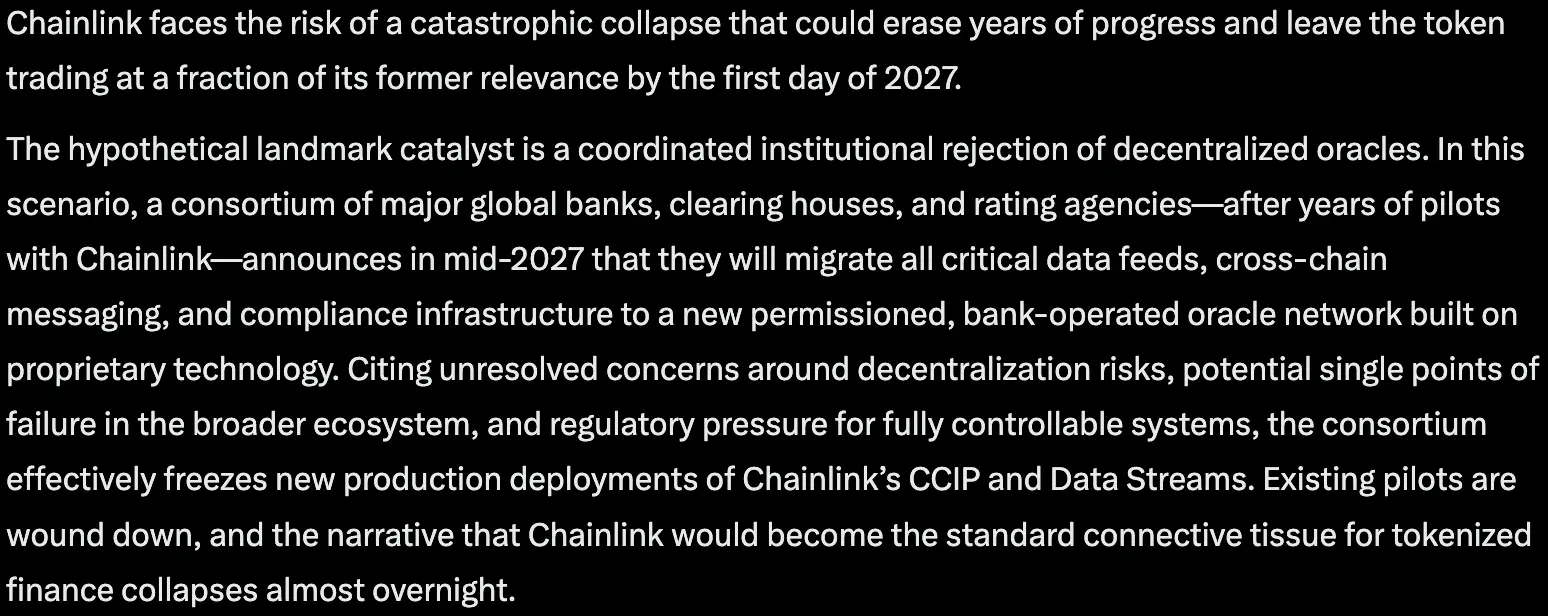 Claude AI Forecasts Chainlink Plunge in 2027
 XRP Crashes to $0.87 as ETF Assets Fall Below $1 Billion
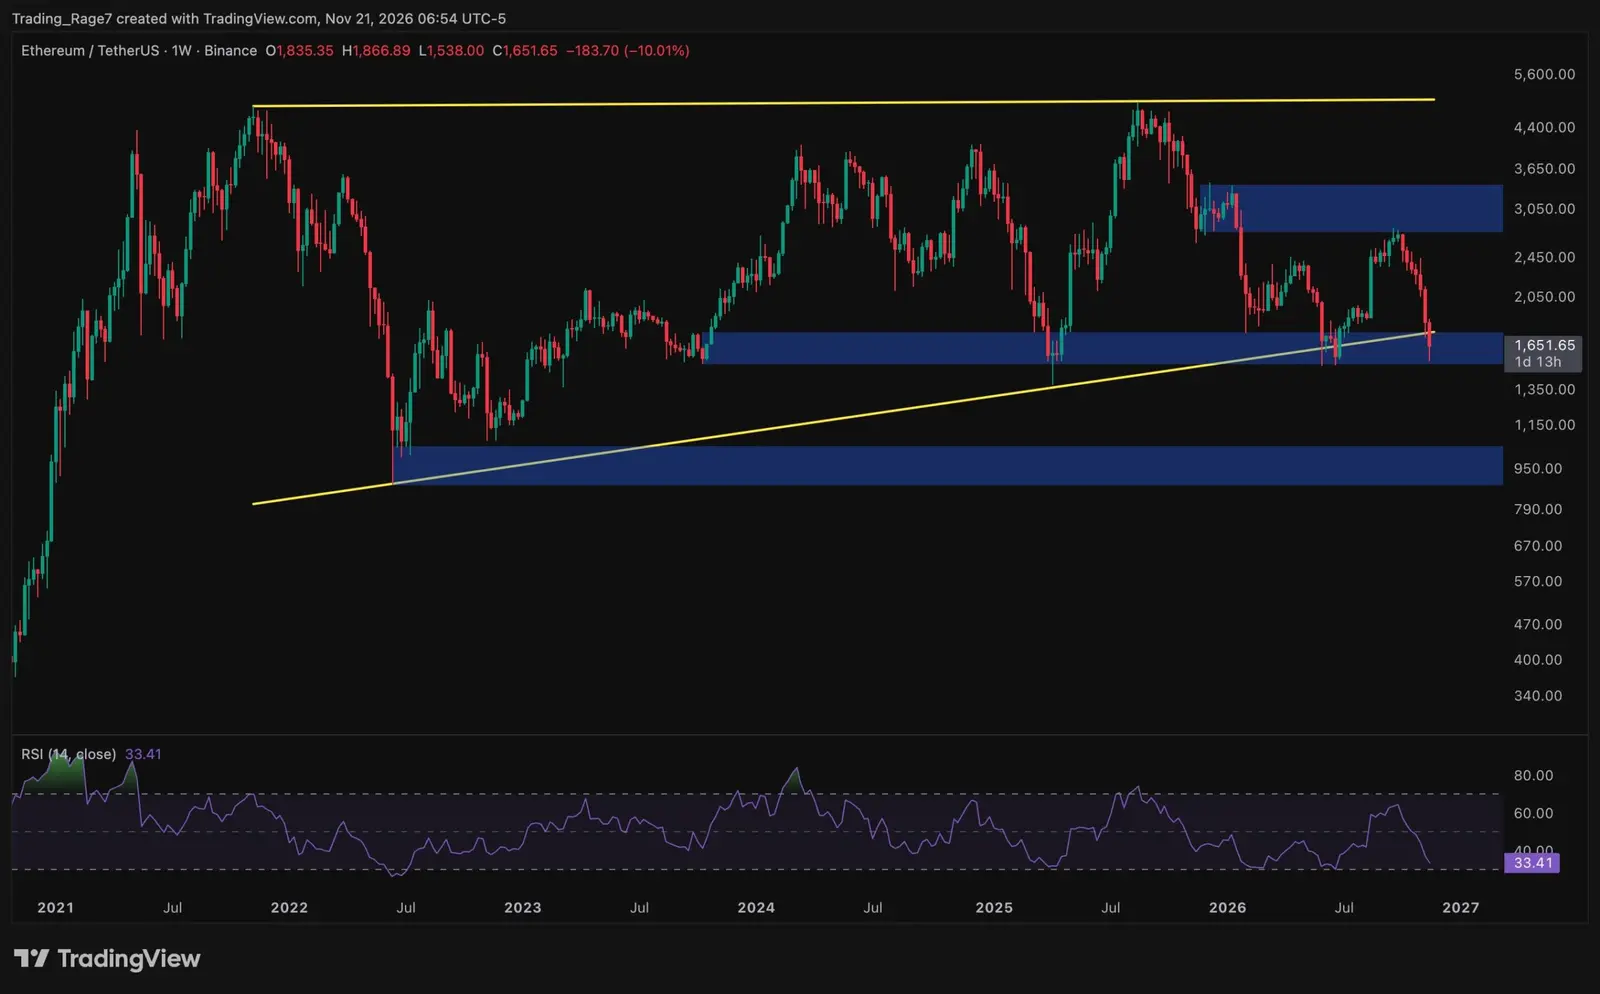 Ethereum price analysis: Did ETH hit its macro bottom after a 30% monthly drop?
The MVRV ratio compares Bitcoin’s current market price to the price at which most coins were last moved. When the ratio falls into the lower third of its historical distribution, analysts often interpret it as a sign that the asset is undervalued relative to the cost basis of its holders. Darkfost noted that the metric has now entered a zone that, in previous cycles, preceded periods of steady buying by long‑term investors. The recent price action, however, suggests that demand from exchange‑traded fund (ETF) hopefuls is cooling, limiting the upside momentum that had pushed Bitcoin close to its all‑time highs earlier this year.
The MVRV’s descent to below the 30th percentile mirrors patterns seen in 2019 and 2020, when Bitcoin entered prolonged consolidation before launching into a new bull run. Darkfost explained that the metric’s decline indicates many coins are being held at a loss, creating a potential supply cushion if owners decide to sell. Yet the same pressure can also encourage accumulation, as lower prices make the asset more attractive to cost‑average buyers.
Will Bitcoin’s Price Break the $87,000 Ceiling?
Data from on‑chain analytics show that realized price – the average price at which coins last moved – remains near $30,000, while the market price hovers around $73,000. This gap widens the MVRV spread, reinforcing the notion that the market is pricing Bitcoin below the average cost basis of its participants. At the same time, weekly inflows into Bitcoin‑focused ETFs have slowed, suggesting that institutional money is waiting for clearer signals before committing larger sums.
Traders remain divided on whether the $87,000 level will finally give way. Some argue that repeated rejections indicate a strong resistance zone, while others point to the historical precedent of MVRV‑driven rebounds. If the metric continues to stay low, it could signal a deeper correction before a new accumulation phase gains traction. Conversely, a sudden surge in ETF demand could lift prices back above the barrier, resetting the MVRV to higher percentiles and altering market sentiment.
Looking ahead, the next few weeks will likely determine whether Bitcoin settles into a prolonged accumulation period or experiences another sharp pullback. Analysts will watch the MVRV closely, along with ETF inflow data and macro‑economic cues such as interest‑rate trends. A sustained rise in the ratio could reignite bullish expectations, while a further decline may keep the market in a cautious stance.
Frequently Asked Questions
What does a MVRV below the 30th percentile imply? It suggests that Bitcoin’s market price is low relative to the average price at which holders last moved their coins, a condition historically linked to accumulation phases.
Why is ETF demand important for Bitcoin’s price? Spot ETFs provide a regulated avenue for institutional investors to gain exposure. Strong inflows can boost demand and push prices higher, while weak inflows may dampen upward momentum.
Can Bitcoin break the $87,000 resistance soon? The answer depends on whether new buying pressure, especially from institutional sources, emerges. If demand stays muted, the level may continue to act as a ceiling; renewed interest could see the price breach it.